For many months, we’ve been aware that the S&P 500 and the other broader US indexes have been in an extremely bullish rally cycle that has driven the US stock markets up and up and forward. From mid-December (http://www.gunner24.com/newsletter/nl-121116/), with a good conscience we could work on the assumption that the S&P 500 would have to reach the 2350-2388 target area.
The 2350-2388 is major resistance area and GUNNER24 Main Target of the bull market started on March-6-2009. Still in 2016, the Main Bull Market Target to be worked off could be scheduled for February 2017 being the 12th month candle after the important higher bullmarket low of the month of February 2016 or the 13th month candle by including the February 2016 year-low candle.
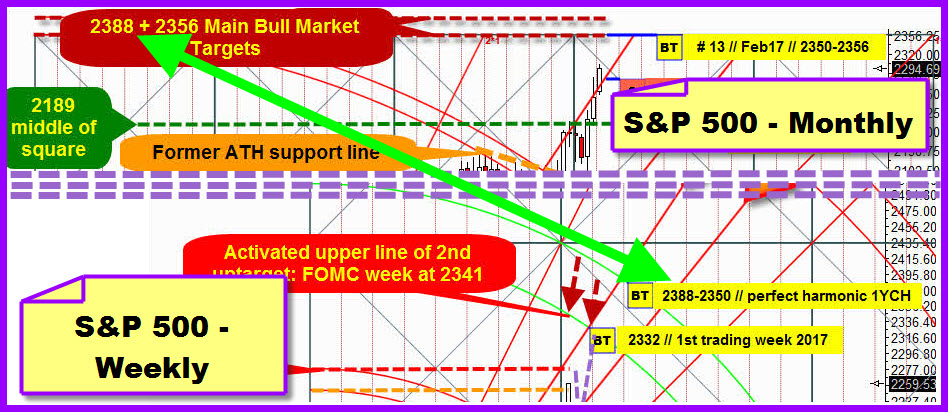
==> The S&P 500 was expected to reach its 2350-2388 pts target area in the course of February 2017 in order to possibly deliver there and then its 1-year-cycle high (1YCH) = watch the perfect harmonic 1YCH reference in picture below:
After studying thoroughly the US Presidency Cycle, (http://www.gunner24.com/newsletter/nl-012917/), the 2350-2388 Main Bull Market Target to be worked off was scheduled for the trading week February 13 to 17. It was at the high of February 15 when the Main Bull Market Target was reached for the first time at 2351.30 index points. After a the important February top the market was expected to correct 6 to 8 trading weeks.
After the first time being reached the Main Bull Market Targets once more it went up by a schnapps, and on March-1, the S&P 500 ultimately succeeded in reaching 2400.98 points, the current alltime-high (ATH) and the present year high. Since then, the market has been consolidating/correcting on a high level, scarcely below the ATH. The Friday close was at 2378.25.
Ok, let’s get into the analysis now just observing what we’ve got and what we see.
1. Price factor: the maximum range (2388) of the Main Bull Market Target was overshot with the 2400.98 ATH which is fundamentally to be assessed as bullish. The Main Bull Market Targets to be overshot indicates that the market wants to go still higher the coming months/years.
All the same, it’s for sure that the 2388 have turned out as an extremely important and maybe strong resistance mark permitting that this trail released a most significant top. It might actually be matter of the final 1YCH because:
==> A) so far, the index has only worked out JUST ONE daily close above the 2388 pts. In fact, it was the day the ATH was reached. On March-1, the market succeeded in closing at 2395.96 pts. Neither before nor after March-1, another daily close above 2388 succeeded. The second highest daily close in the year 2017 can be recorded on March-15. The close then was at 2385.26 pts.
==> B) The index has not succeeded – so far – in generating a weekly close above the 2388. The last four weekly closings read as follows: 2378.25, 2378.80, the week when the ATH was reached closed at 2383.12, before it was 2367.34 pts.
Since the 2400.98 ATH, the lowest daily close was at 2362.98 (March-9) CONSPICUOUS & IMPORTANT AS WELL: the lowest price after the ATH is at 2354.54 (low of March-9).
Can you see it too? The index is now consolidating/correcting pretty exactly within the Main Bull Market Target Area: Bottom 2350, top 2388 pts.
In the very first reaction to a Main Bull Market Target, such a performance is to be classified as rather bullish. Frequently, Main Bull Market Targets lead to pretty harsh rebounds and visible changes in trend after all, and often – at least in the past, in times of normal money policy – to strong sell-offs. In the current case, the index is consolidating narrowly below the maximum. Main Bull Market Target however, scarcely below the 2388. So far, the index has been bearing resp. defended the Main Bull Market Target Area between 2356 and 2388 rather successfully!
==> Conclusion price factor: Clearly bullish looking behaviour since reaching the target zone = Main Bull Market Target 2350-2388 and the ATH.
2. Time factor:
We can still presume – even though the last important high didn’t come in during the month of February – that the March-1 ATH might have marked a very important turn. The possible 1-year-cycle high after exactly 13 month candles of uptrend – as broached above already. For now, this potentially important high might have "gone astray" by just one or two trading days, so it didn’t come in before the 1st day of the new trading month.
Besides, we’ve still got this conspicuousness in terms of time and this probably important mathematic context.
The absolute bear market low of the year 2009 was attained at 666.78 pts on March-6.
The ATH came in on March-1-2017 being at 2400.98 pts.
Pretty exactly 8 years are between the bear market low and the ATH.
==> The 2400-ATH-environment might be resp. might want to be the important 8-year-cycle high.
AND ==> 2400.98/666.78 make = 3.60085, now multiplied by 100 amounts to exactly 360.085, and this looks like that it took rather exactly 8 years to accomplish, to complete a 360-degree cycle.
My conclusion of the time factor analysis: the ATH of March-1-2017 seems to be extremely important. It might be matter of a very significant high, a possible 1 and 8 year cycle high!, correspondingly perhaps being strong enough:
A) at least to ring in a distinctive sideways phase that doesn’t have to correct deep in respect to the price development. Yet it might last several months just like actually the majority of the breathers within the 2009-2017 bull market.
B) If time - possibly combined 1 and 8-year-cycle high – meets price - Main Bull Market Target 2350-2388 – in that case, also bearish developments are allowed and even to be expected.
==> BA) A deep correction according to the price began at the ATH. In that case, most certainly a backtest of the year 2016 closing at 2238 pts would be implied during the coming weeks/months.
==> BB) The maximum extension of the Bull Market was reached at the final 8-year-cycle high on March-1-2017. Thus, a new multi-month bear market may have begun at the ATH.
Scenario B) und therewith BA) und BB): I nearly exclude them betting on THIS!
==> 2508 points that are supposed to be worked off in May 2017:
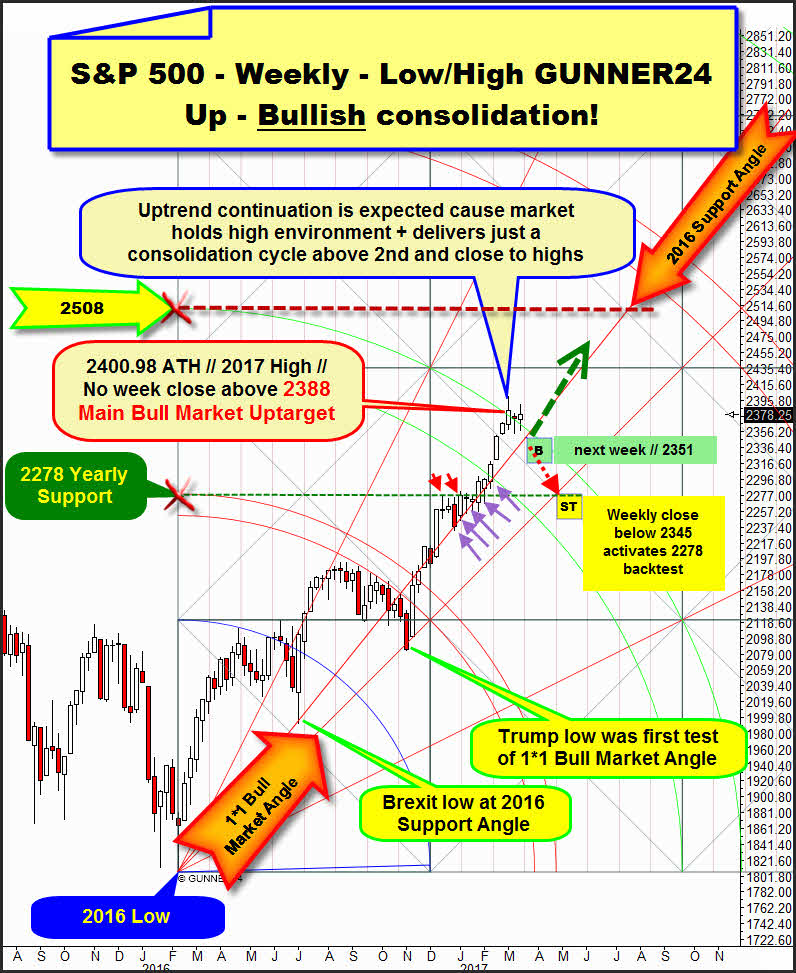
Above, I display for you the extremely market-influencing Low/High GUNNER24 Up Setup in the weekly time frame that I analyzed several times in 2016 (last on 12/11/2016).
It is applied at the absolute year low of the S&P 500 (02/11/2016) measuring the initial up impulse into through the first important 2016 high at 2111.05 pts in April 2016.
The recent rally leg into the presumed 1-year-cycle-high & possible 8-year-cycle-high starts at the very first test of the 1*1 Bull Market Angle and the attained Trump low.
The first very successful test of the 1*1 Bull Market Angle was the trigger for the recent bull thrust in whose course the 2nd double arc yearly main resistance was dented at the ATH = 2017 high 2 week candles ago!
So, the recent rally leg was able to overshoot scarcely the 2nd double arc yearly main resistance. This is a rather bullish development just as the fact that now as many as three weekly closings above the upper line of the 2nd double arc are to be seen. Even though the 2nd double arc and its overall negative energy so far deter the market from keeping on ascending forcing it into a pullback, a consolidation, the last three weekly closings are scarcely above the upper line of the 2nd double arc resistance. Thereby, up to now as if the upper line of the 2nd meanwhile exerts support that might resp. should have to impede a deeper price correction.
Anyway: although no weekly close above 2388 could be reached, the development since the ATH in terms of the price takes a rather moderate and well-ordered course above the upper line of the 2nd and very narrowly below the ATH. I see a bullish consolidation since the ATH that will compellingly have to end in one resp. several more tests of the 2016 Support Angle!
The 2016 Support Angle is nearest mega important support for the S&P 500. Since the Trump low, it has kept the rally strictly in line. For this, watch all the many successful tests of the 2016 Support Angles at the purple arrows.
Since that frequently the 2016 Support Angle is proven rally support, we may assume that the current consolidation period will come to its final low with the next test of the 2016 Support Angle to test back then swiftly the ATH area. The 2016 Support Angle takes its course at 2351 for next trading week. There and then, a pretty risk-less long-entry for the 2508 pts till May 2017 may ensue. Yet more about this just after the next chart…
Before that, I’d like to go into the possible scenario: What it means if the 2016 Support Angle doesn’t want to bear at the next test.
As a start: ONLY a very first weekly close BELOW the 2016 Support Angle would be the very first strong indication that ACTUALLY the combined 1 & 8-year-cycle high was brought in at 2400.98. Only if the next and/or the trading week after next close below the 2016 Support Angle – from below about 2345 pts! on – the bears will be allowed to hope for more.
Until then applies this: "The trend is your friend"! Thereby, according to this motto, we’ll have to find low-risk long-entries and trade in due consideration of narrow stop-loss placements!
If a 2016 Support Angle sell signal arises till the end of the week after next, IN SUCCESSION it will have to come to the second test of the very strongest support of this bull market.
With 90% of probability, this 1*1 Bull Market Angle will be worked off then at about 2278 pts in the course of May. Technically at this second test the 1*1 Bull Market Angle should newly trigger strong bouncing energy that is supposed to force the S&P 500 in succession into even higher ATHs till the fall of 2017!!
==> It will take the very first future weekly close below the 1*1 Bull Market Angles to be a first powerful and sustainable sell signal! And the final confirmation that the important 8-year-cycle high was brought in at 2400.98 pts!
The quintessence of the GUNNER24 Method is that we can always try to interpret the comportment of the price at naturally existing magnets that again leads to our trading decisions.
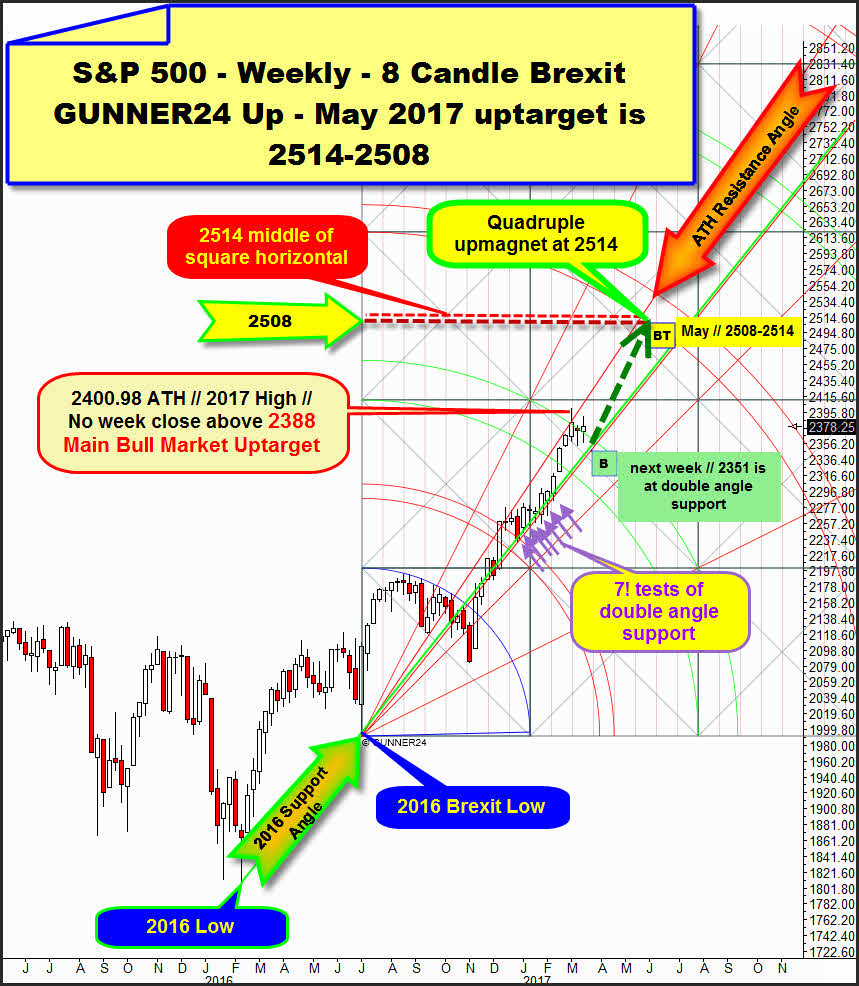
Also the valid 8 Candle weekly up that can be applied at the reached Brexit low strongly indicates that an extremely bullish consolidation began after the ATH. As a rule, this consolidation is supposed to dissolve upwards!
Also the Brexit GUNNER24 Up puts out that the recent rally cycle succeeded in penetrating rather strongly into an important double arc resistance. Such a comportment is always a hint to a sustainable rally continuation. In the Brexit GUNNER24 Up, with the attained ATH likewise the 2nd double arc resistance could be overshot scarcely. With the last week closing, even a first narrow close above the upper line of the 2nd succeeded! Also in this setup, the index is now consolidating scarcely above an important yearly resistance double arc.
==> Thus, both valid weekly up setups indicate in unison that since the ATH just only a pullback is ongoing resp. a short-lived consolidation seems to have begun now recharging its battery in order to attempt soon some new higher highs!
In the chart above, I highlighted in light green the most obvious strongest rally support, the 2016 Support Angle. The 2016 Support Angle is often positively tested support angle in the yearly time frame after all, since it can be derived from the extremely important higher bull market low of February 2016.
From the Brexit low, furthermore springs a most important and often positively tested Gann Angle. It takes its course nearly parallel and very narrow below the 2016 Support Angle. Thus, these two Gann Angles form a so-called double angle support. An extremely strong support magnet in the combined yearly and weekly time frames!
Where – if not there – is great, cause important and manifold positively tested strong support? Optimally appropriate for a low-risk long-entry in trend direction?!
==> Thereby, I’m giving this long-recommendation: If the weekly pullback reaches the 2351 next week, go there and then long with SL 2340! And uptarget 2508 to 2514.
The double angle support is supposed to become the trigger for the next strong upleg that in the first step, as a rule should have to test back the 2400 seriously.
Since the coming upleg furthermore should have to lead to a weekly close far above the upper line of the 2nd double arcs in the Low/High as well as in the Brexit setup, the index would have generated its next important weekly buy signal.
Additionally - of course - a first weekly close above the 2388 is next very strong GUNNER24 Buy Signal. Such bunch of fresh buy signals in the weekly time frame activate the lower line of the 3rd double arc in the Brexit setup as next important uptarget for the bull market. Namely in the course of May 2017!
==> For May 2017, the lower line of the 3rd double arc takes its course at 2508 pts in the Brexit setup there forming a weekly double upmagnet for the index, together with the 2508 pts horizontal that is identifiable as next higher natural resistance in the Low/High up setup.
==> For May 2017, we can even identify a weekly quadruple upmagnet at 2508-2514! It is formed by A) the lower line of the 3rd from the Brexit setup, B) the ATH Resistance Angle – highlighted in the Brexit setup, C) the 2514 middle of square horizontal resistance from the Brexit setup and D) the 2508 natural horizontal resistance from the Low/High setup.
Be prepared!
Eduard Altmann


