The S&P 500 and the FDAX have gained +0.5% so far in 2014. The NASDAQ-100 is the "winner" of the major indexes we track. Hitherto in 2014 it has risen by +2.66%. The Dow Jones is the taillight with a low of -2.23%.
All in all and depending on where an investment would have been made the last 2 months, the profits out of the investment into these indexes or into their respective stocks were underneath the inflation rate thereby. This reckoning is made – the pithy way - to put the positive all-time-high-hooey in perspective. We have to take note of these new US bull-highs, but that’s it. As for the major indexes, 2014 is going to be rather a year for traders than in investors’ or investing year, respectively.
The stock markets diverge in 2014, performing lousy so far and spreading the fear of topping and of a hefty correction, combined with the euphoria of new bull-market highs. These ones are coming about tenacious-, not convincingly. Above the markets there are mighty monthly magnets, shown us by the GUNNER24 Forecasting Method. Still these magnets and future powerful resistances are attracting some markets because of their magnet effect. The markets aren’t yet ready to turn persistently because by the Friday and simultaneous weekly close for instance in the NASDAQ-100 and S&P 500 some new weekly buy signals were generated.
However, new monthly buy signals aren’t possible now before the March close, at the earliest. But whether they show is doubtful. And even if they do show it might be rather matter of misinterpretation because as early as in April the weak seasonality may set in that is supposed to pull down the markets through the autumn.
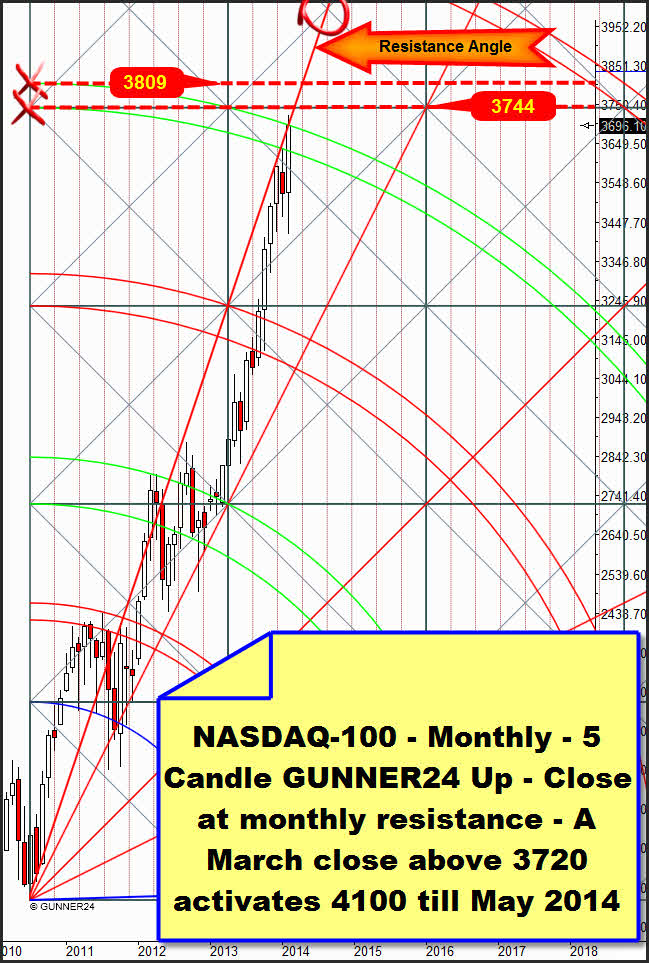
On the last February trading day the NASDAQ-100 avoided – if at all possible – to generate a new buy signal on monthly base. As notified two weeks ago in the free GUNNER24 Forecasts, the index had to reach the 3695 and the 3700. We wanted to buy a February close above 3720 because thereby the resistance of the upper line of the 4th double arc in the monthly 5 Candle GUNNER24 Up would be overcome:
And what does that thing do on Friday? It faked around the 3700 as well as around the 3720 and ditto around the 3695… You know, the 3700 were daily resistance over the whole last week… At the Friday opening, intraday that thing immediately breaks the 3700 upwards reaching the 3722.78 at the daily top – that represents our monthly buy-trigger mark - within 45 minutes. Then the market reacts going down to the 3710 and turning up again to the 3721.82 thus producing an intraday double-top, popping afterwards from the 3700 monthly resistance to the 3665, recovering into the close and closing at 3696.10, exactly at the upper line of the 4th and thereby at the monthly resistance.
Altogether just 3 minutes of closing above the 3720 could be produced. Of course, the entire Friday action is no coincidence, but it orients itself by important resistances and supports.
So I pronounce just as it is. A monthly buy signal was clearly "avoided" even though the market should have had the strength to generate it. A monthly close above 3720 would have been tangible if – as usual in a normal uptrend – Friday had bowed out strongly into the closing. The late Friday sell-off makes me rack my brain about the way things are going on.
Technically, Friday sell-offs don’t work at all in an intact uptrend. It’s totally unusual… Besides, they are to be noticed at important tops… As mentioned, the weekly time frame did generate a buy signal, and the monthly indicated an important top with the Friday action! For with Friday the important monthly resistance of the ruling Resistance Gann Angle was overshot a little bit. The way the market is going to react on that is clear: It is with a hefty intraday sell-off… Since this resistance exists on monthly base, the rebound effect from this angle may keep on for several days leading to further hefty declines the coming days.
Even if it continues going up in case next week the 3720 is overcome on daily or weekly closing base, this bull will possibly come to a sudden and brutal end at both next higher resistances – 3744 and 3809.
In a comparative consideration, the sell-off on late Friday turned out much heftier in the NASDAQ-100 than in the Dow Jones or S&P 500. Also the retracement from the sell-off lows into the monthly close turned out much weaker in the NASDAQ-100 than in both other majors. The NASDAQ-100 has definitely been the rally-leader of the last years. Only if the leader is through with its rise turning finally, as well all the others will be allowed to fall severely!!! Its reaction and its performance on the GUNNER24 Resistances worked out in the text above are crucial for the "proletariat" and the further course of this bull-run.
If the index topped on Friday, in a 3-5 month correction it will have to head for the support of the 3rd double arc in the setup above = 3100 to 3000. A monthly close above 3720 will activate 4100 points till May 2014.
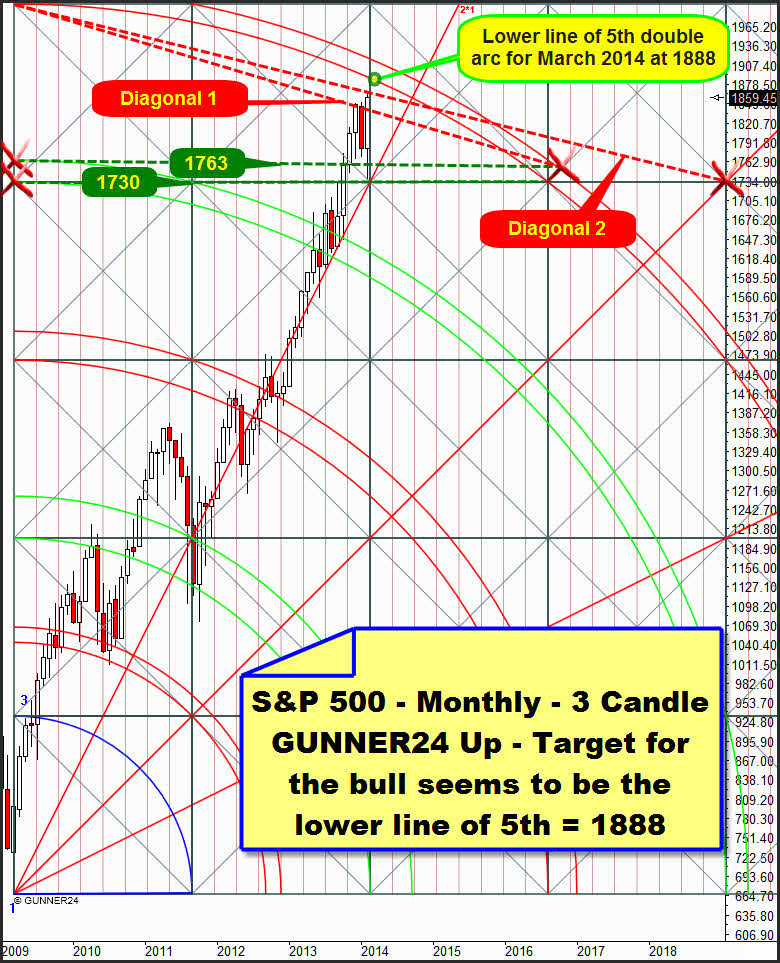
The S&P 500 has a likewise hard time in overcoming its monthly resistances:
No sooner had it cracked the monthly resistance diagonal 1 in late February, than on Friday he had the next higher resistance diagonal – diagonal 2 – ahead. Of which the existence is confirmed because the Friday top = new all-time highs was brought in there to a T, giving away the market after the touch with the diagonal 2, first 20 points in 40 minutes (1867-1847). The recuperation at closing went to 1859 then. Thus, at least the weekly buy signal, mentioned already, was generated.
To become interesting is well promised the start into next week. Let’s have a little look at the most recent events. On the last trading day of the year 2013 the S&P 500 reached the resistance diagonal 1 closing exactly at this resistance. An 8 day correction followed starting the very first trading day in January. At the end of the 8 day correction, on January 14-15 it briefly went up for two days to the new all-time high of 01/15 at 1850.84 before but still the market was finally repelled severely from the monthly resistance diagonal 1 in to produce consecutively the red January candle.
It’s conspicuous that now in February, newly on the last day of a trading month the S&P 500 might have produced an important top at a GUNNER24 Resistance Diagonal, this time the diagonal 2, being possible again the start of a correction on the first trading day of the following month.
Of course, this possible correction may become as strong as the one in January… The market is in a topping process. Accordingly each monthly resistance we can recognize and identify is supposed to be able to change the trend.
Why hasn’t the market fallen lower now than the 1737.92 achieved on February 5, 2014? And above all, why it went steeply upwards then even reaching new all-time highs afterwards?
First of all, the diagonal 1 was thoroughly a very strong monthly resistance! The market literally cracked down after all and it did quite fast, say within just 3 weeks of correction the market gave away 110 points. But at the low of the correction an important monthly support was reached.
The S&P 500 dipped into the support zone of both horizontals that start from the intersection point of both lines of the 4th with the beginning of the setup. This support zone (1763-1730) newly developed strong rebound energy that is going to take the market to the main target now. This main target is the lower line of the 5th, being at 1888 index points for March!
It’s a possible main target that we could calculate and identify several times during the year 2013. Last we did here in the GUNNER24 Forecasts, issue 12/22/2013.
To me, really just the question is due to be asked which way this target will be worked off. A) Is it via a detour: Beginning next week the market is going to correct low again, for instance down to an important weekly support, about 1825-1820. Or B) this time it only takes little time for overcoming the diagonal 2, maybe correcting the coming 5-7 days just to about 1845-1848, thus testing back the sell-off lows of last Friday then quickly taking an approach run to the 1888 that will be worked off till mid-March 2014 in that case. For the moment I prefer the B variant!
In gold things are becoming most interesting now. Technically, in 2014 gold is supposed to perform better than the major stock markets again. Consequently, if you really want to invest and fund in a longer term, gold is actually the better choice than US stocks. With metal, you’ll be able to make good at least the losses by inflation in 2014… The 2014 performance is now at about a 10%, 4x higher than in the NASDAQ-100.
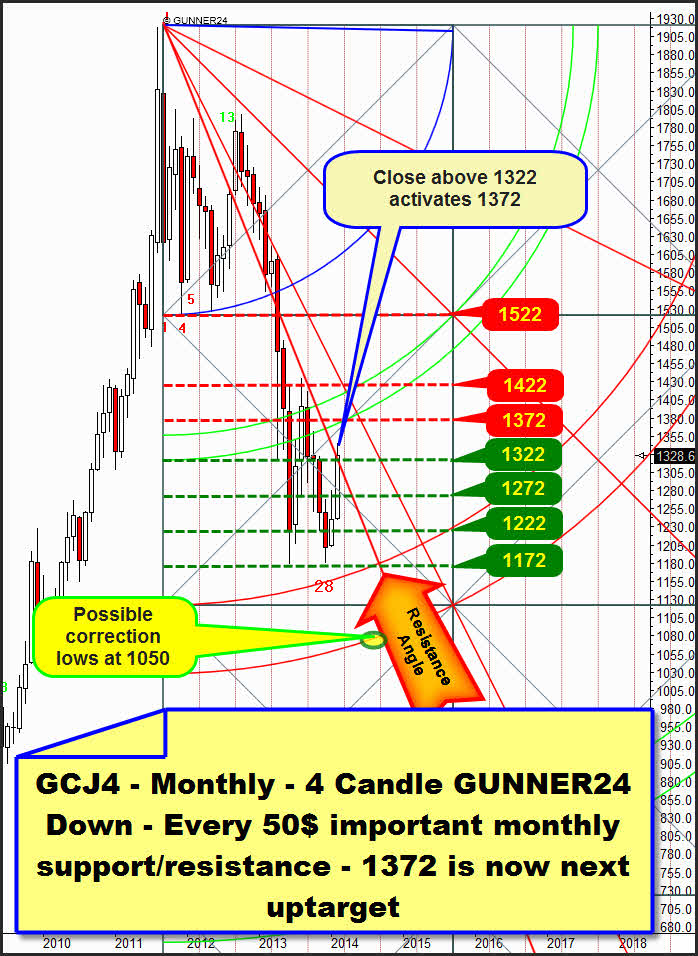
In contrast to the S&P 500 and NASDAQ-100, furthermore gold generated a monthly buy signal with the February close. Contrary to both indexes, in spite of a thoroughly strong intraday decline on Friday, it decided to close but still above the most important monthly resistance, you see. The 1322 is overcome on monthly base - even though but narrowly. Thus, the next uptarget in the monthly time frame should technically be worked off as early as in March 2014:
In the monthly time frame, since the break of the first square (1522) in April 2013 gold very frequently oriented itself by the arisen support and resistance 50$ increments after all. The next higher monthly uptarget = magnet = resistance is the 1372 horizontal now. The 1322 horizontal situated below was taken in February. That’s why I sketched it green = support in the monthly 4 Candle down. Likewise in February an important Resistance Angle on monthly base could be overcome. This one is likely to mutate to an important support in the course of March. The angle noticed as Resistance Angle in the chart above takes a course at about 1305 in March 2013 = first important March support below 1322!
In the area of the 1372 horizontal also the resistance of the lower line of the 2nd double arc is lying for March. Or let’s say, the 1372 horizontal intersects this lower line of the 2nd exactly in March 2014 thereby forming a so-called Gann Magnet that is supposed to attract the market now. If it is reached, actually a very strong rebound from this magnet will be expected to be visible. That means the 1372 is a very strong resistance. The countertrend on daily and weekly base might come to an end there. Consecutively the 3rd double arc and the 1050 can possibly be reached till summer 2014.
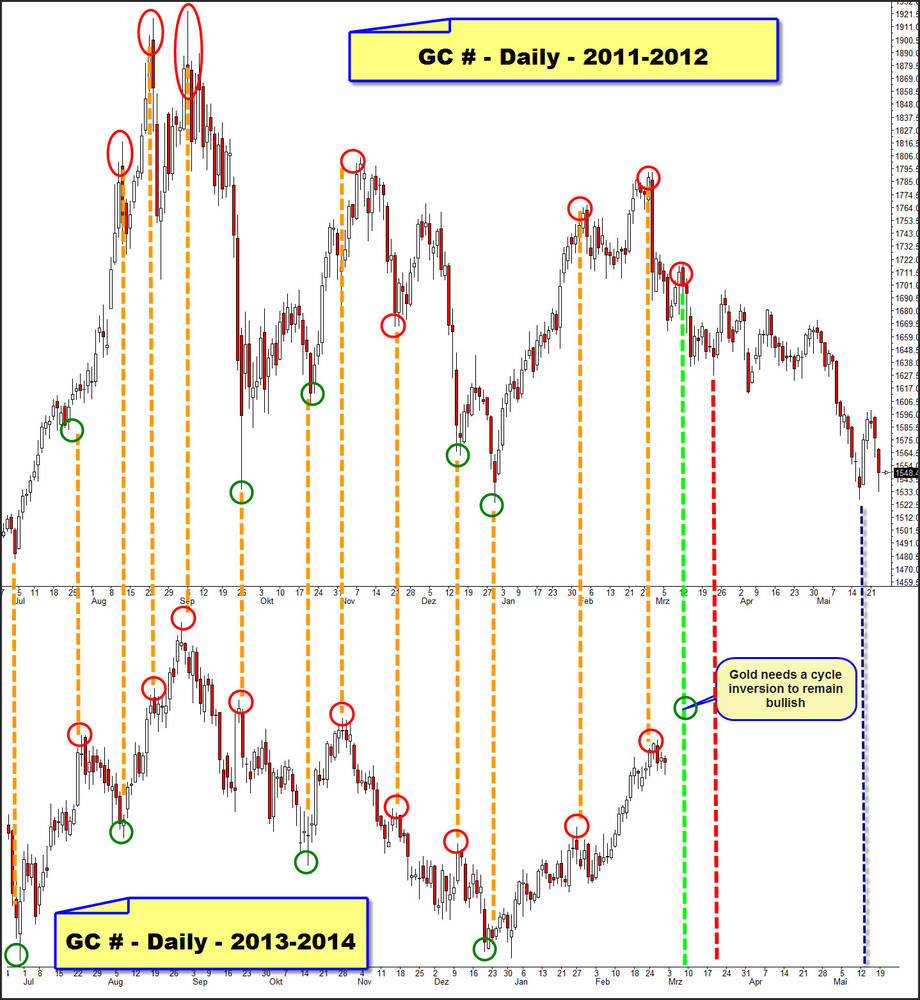
But for an approach run to the 1372 gold will need now a cycle inversion on daily base! This one will have to happen within the next 5-10 trading days. Otherwise we can forget about a test of the 1372 in March 2014!
Since the middle of 2013, gold has been following the cycle 2011-2012. Beginning at the June 2013 lows, it has reflected its 2 year rhythm just perfectly, as it were. The turning points can be cleared away almost completely, i.e. with maximally 5 day intervals. I visualized that state with the dotted orange verticals:
Congruously with the preset from 2012, with the current 1345.60 highs of 02/26/2014 gold started to correct. The rightmost orange dotted vertical makes clear that "according to plan" last week an important change was due. Gold reacted to this deadline now correcting since last Wednesday, since the 1345.60 highs. If it wants to keep on performing as it did in 2012 it will be going to fall now till mid-May 2014!
If the price performance shapes just roughly as its cycle determines it will newly reach the 1200$ region till mid-May 2014! I.e. the Wednesday high may – considering this cycle – thoroughly have been the final countertrend high!
To deny and break this cycle, technically at the next given changing point (green dotted vertical) – this one is around March 10-12, 2014 or at the very latest towards the changing point after next (red dotted vertical) - gold will have to shape a new higher daily swing high! The new monthly GUNNER24 Buy Signal makes us suppose that this important cycle inversion is due for March 2014!
In these whipsaw markets of the last weeks that might confuse any trader thus leading mercilessly to burning the trading account the professional signals have got their special importance. You get them in the GUNNER24 Gold Trader!
You best register with our GUNNER24 Gold Trader now. That’s where we oversee the optimal entries and exits for you. Especially in the difficult market situations where many factors have to be considered the Gold Trader is backed by the additional GUNNER24 Signals based on the combined 1, 4 and 8 hour setups to catch the optimum entries and exits.
The GUNNER24 Gold Trader will provide you with the critical knowledge you need to forecast and analyse the precious metals with the GUNNER24 Forecasting Method. All the GUNNER24 Trading Signals you receive real-time are based on the actual Gold and Silver Future. The NEW GUNNER24 Gold Trader is a must for every actively working investor and trader who wants to trade successfully in everyday trading. The insights you receive from the head trader Eduard Altmann (and discoverer of the GUNNER24 Forecasting Method) are truly amazing sometimes. I promise!
Click the button below and order the GUNNER24 Gold Trader - $39.90 US a month. For 201 members and up - $49.90 US a month.
Be prepared!
Eduard Altmann


