Platinum targets 748$ now
A further indication for the global economic deflation cycle is delivered by platinum with its February 2015 close. A severe sell signal was triggered. This sell signal activated now a 748$ downtarget. The 748$ are supposed to be worked off within the coming 13 months.
Most likely being the harbinger for gold and silver, platinum was the first of the important precious metals to fall short of its course lows of the year 2014. During the next 4-6 weeks it may – the GUNNER24 Method would permit it now – switch into the panic-sell-off mode. Indirectly influenced by platinum, silver and gold may certainly be engulfed in the abyss as well…
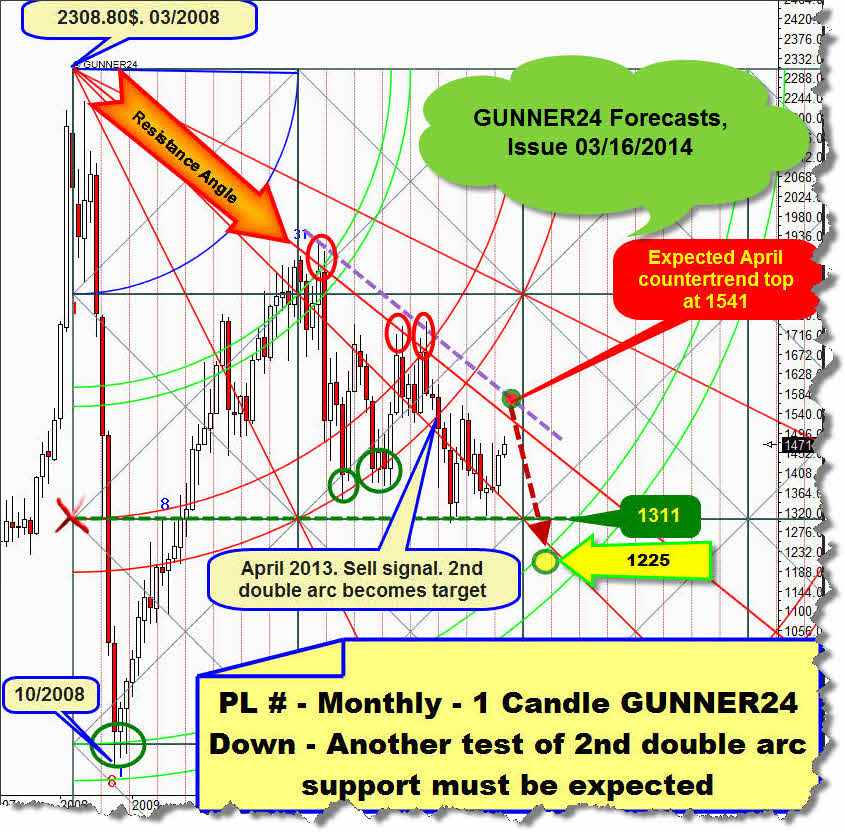
Before I go into this possible respectively allowed panic-sell-off mode, let’s first have a look at the past: Almost exactly one year ago, the white metal – then, mid-March 2014, it quoted at 1471$ - was expected to have to work off first an important countertrend high at 1541$ till April in order to decline afterwards down to the 1225$ until July/August 2014:
The 1225$ at the upper line of the 2nd double arc were activated downtarget at that time, since the 1st double arc broke finally in April 2013. Before taking in hand this actualized 1 Candle GUNNER24 Down Setup in the monthly time frame, we’ll have a look at the current technical situation of the metal incl. cross-check concerning the price and time targets prognosticated a year ago:
The next important countertrend high expected at 1541$ for 04/2014 was delayed through 07/2014. Being a forecaster one can be okay with the 1523.80$ reached by the countertrend high. The forecast 1225$ downtarget was not attained before 10/2014 instead of 07-08/2014. This lag was due to the fact that the countertrend high was marked as many as 3 months after the supposed 04/2014.
Now to the technique
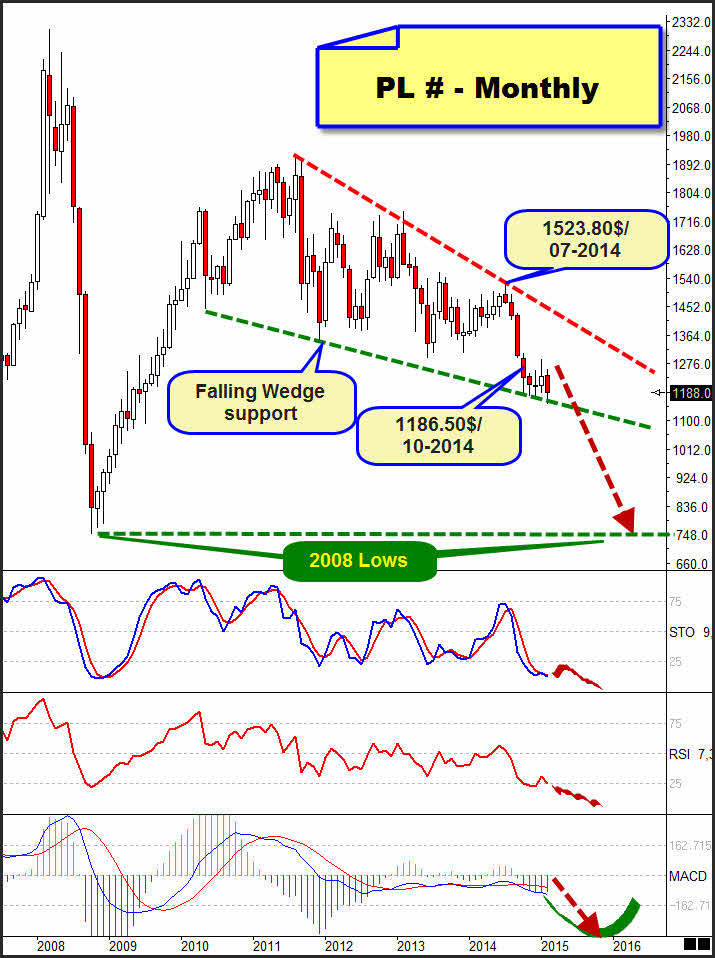
Since 2011 a falling wedge has been forming. This one should be dissolved downwards.
The reason: For 5 months, the falling-wedge support has been tested intensely without being able the metal to come loose just rudimentarily from the wedge support. So we are experiencing a consolidation at the lows that are known to be dissolved downwards in the majority of cases.
With its February 2015 low, platinum produced lower lows than in 2014. February 2015 closed at 1188$, the lowest monthly close since 06/2009 (1185.30$). Hence, the factor price doesn’t indicate in the least that a price rise = change in trend is to be expected.
In my opinion, MACD, the idlest momentum oscillator is starting to gather pace again now. The MACD signal lines delivered the last sell signal in August 2014, and their distance is increasing. The MACD histogram is beginning to intensify the decline. Since it is far away from an extremely oversold condition, this state may go on for many, many months. Perhaps 12 more months… So, MACD is signalizing that the price decline has to continue and even get worse.
Even though Slow Stokes and RSI are in the oversold regions, thereby "being allowed" to turn upwards. Nothing is pointing to the tension to be eased at these oscillators. I don’t see anything bullish in the monthly chart.
Thus, the wedge support will/should not hold. The consequence would be the 2008 lows to be headed for. These are situated in the 750$ region.
Now comes the look at the 1 Candle GUNNER24 Down Setup in the monthly time frame:
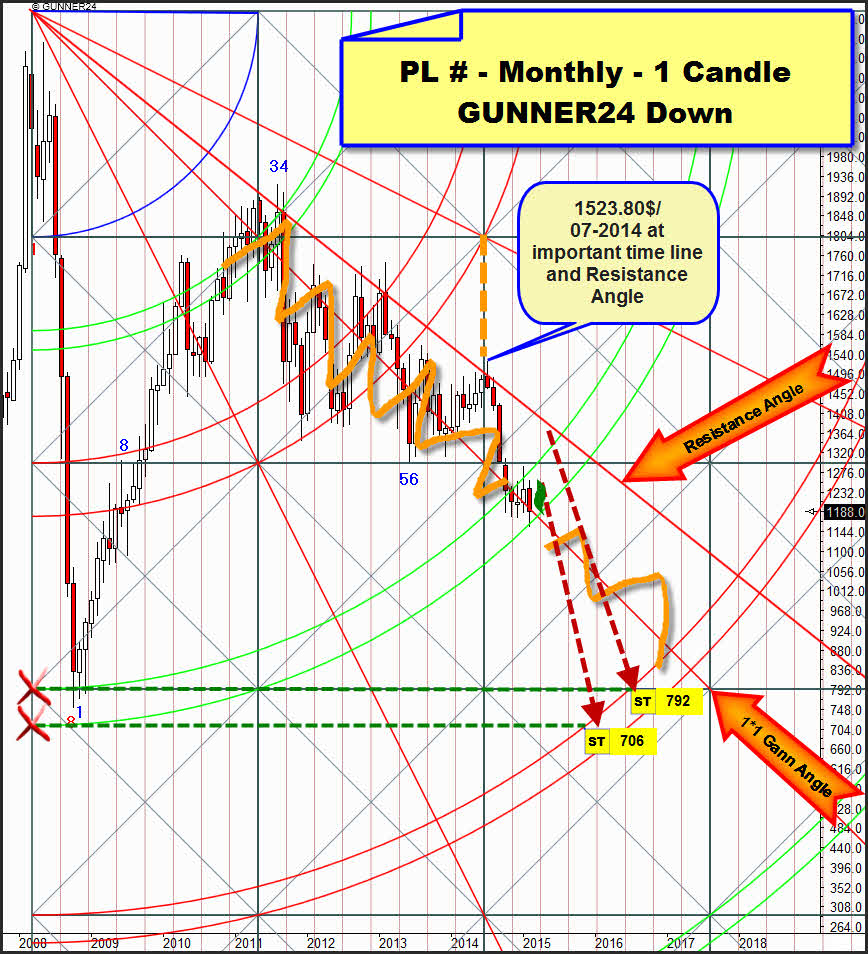
Let’s begin this time at the 07/2014 countertrend top. It was generated at an important time line. Important time lines always lend themselves as important change marks. In this case, this important time line had to be reached after all. Not before the achievement, the market was ready to turn down. Th 07/2014 countertrend high newly reached the Resistance Angle. This one is derived from the 2008 all-time high providing multiply confirmed monthly closing base resistance.
Ergo: Only the very first monthly close above the Resistance Angle is a powerful buy signal on monthly base! An absolutely earliest monthly close above the Resistance Angle in 2015 will activate 1900$!!!
The last 5 months did reach the support of the 2nd double arc. The February 2015 low (1155$) is at the support of the lower line of the 2nd.
November 2014 through February 2015 closed each within the lines of the 2nd. This performance has been preparing the final break of the 2nd double arc. In this case, the upper line of the 3rd double arc would be the next activated important downtarget.
Depending on the month when the 2nd double arc will be finally broken downwards, the possible downtargets will result. The 706$ may be reached till January 2016 if the 2nd will be finally broken on monthly closing base until April 2015.
==> If March 2015 closes below 1155$, the 706$ will be activated.
==> If April 2015 closes below 1170$, about 715$ will be activated (in this case for February 2016).
792$ shall have to be attained if platinum newly succeeds in reaching the Resistance Angle with a multi-month bounce in spite of all the negative omens.
==> A bounce achieving to reach again the Resistance Angle till 06/2015 from the present February 2015 low would have to end at the Resistance Angle. Then and from there, the metal is supposed to sally out to break the 2nd finally working off in succession the upper line of the 3rd till late spring of 2016. I consider this scenario "bounce till 06/2015 and up to the Resistance Angle" having but a chance = probability of a 5% to happen.
There’s still the opportunity of platinum to orient itself in its current decline by the 1*1 Gann Angle for the coming 13 months as well. Since the 2011 countertrend high – so for as many as almost 4 years – the decline has been oscillating more or less powerfully around the 1*1 Gann Angle (orange waves) without breaking it downwards finally. This aggregate condition is certainly allowed and possible for the next 13 months, too…
But - there is a likelihood of an 85% to happen the following during the next 13 months…
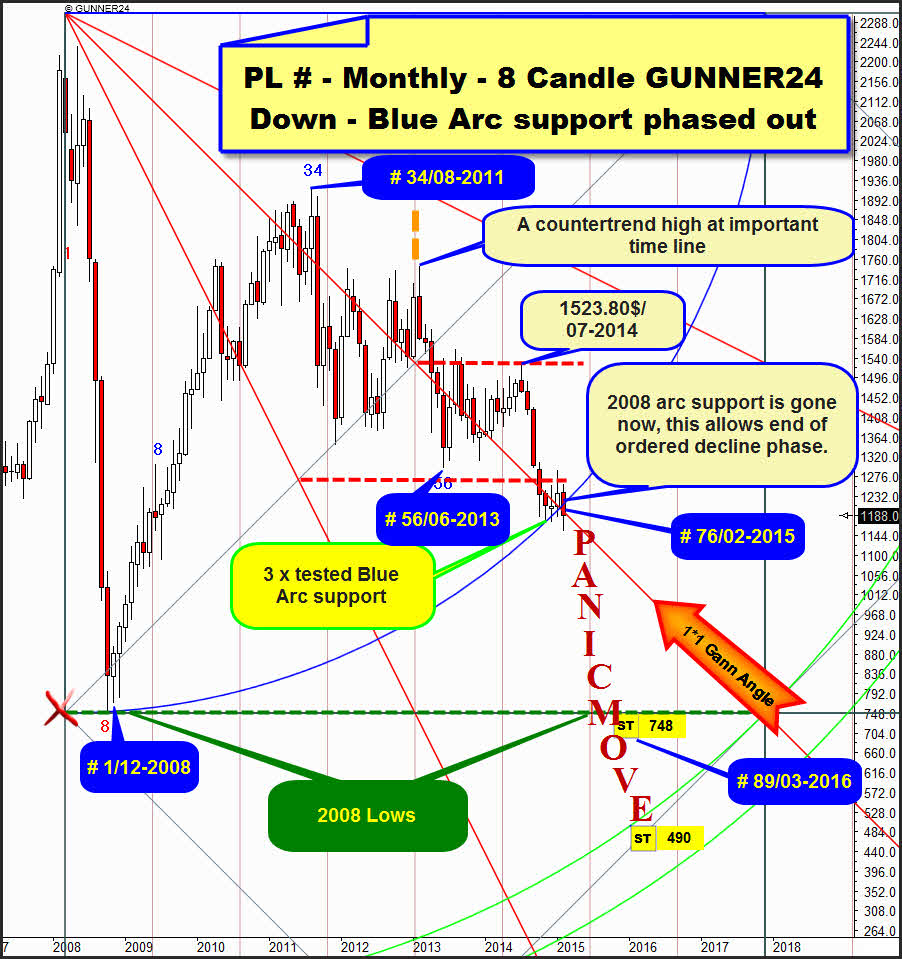
…and thereby I’m coming to the current massive sell signals for the metal. The 1 Candle GUNNER24 Down above indicates after all that the 2nd double arc has been exerting support for as many as 5 months not being generated the next significant sell signal before a future monthly close below the 2nd double arc. The following, considerably much more important 8 Candle down, starting from the 2008 all-time high, delivered a significant and powerful GUNNER24 Sell Signal with the February 2015 close:
The existing arc support being in place since the 2008 low was broken with the February 2015 close. This is a truly dramatic development not at all auguring well for the near future. A support persisting for more than 6 years went down the drain now.
The months of November + December 2014 as well as January 2015 tested the Blue Arc at the lows. These first tests are showing now the current weakness of the metal because no bounce at all from this 6 year support took place.
The break of the Blue Arc on monthly closing base in February 2015 is activating now the first square line support at 748$ as downtarget. The countertrend move begins in 12/2008 = # 1. It shows a significant high in month # 34, a significant low in month # 56 (very close to the Fibonacci number 55). Since now in month # 76 of the countertrend new course lows arose having been dissolved the Blue Arc support downwards, we will have to work strongly on the assumption that the next important low of the countertrend will not be due before the region of the 89th (34+55=89) month of the countertrend.
==> Ergo, the February 2015 is activating a 748$ downtarget that is supposed to be worked off at the latest till March 2016 (76+13=89).
The lower line of the first double arc at 498$ is even allowed now to be the target of a waterfall decline… during the panic, important supports break easily…
In relation to the GUNNER24 Method, the February 2015 close is indicating that the falling wedge will break finally soon, having possibly begun a strong, waterfall-like decline (just think of the Euro and the oil in the 2nd half of 2014…) with the February 2015 development.
Well, short-entries/short-tactics: For the time being, I assume that March is willing to show at least a little counter reaction to the 1155$-February low.
I think, with considerable certainty the metal will be able to reach again the 1205$-1210$ in March 2015. The first short position there. It is quite possible that platinum will even reach the 1222$ again till the end of March 2015. This is a strong combined weekly and monthly resistance magnet, the strongest up magnet for the metal in March 2015. That’s where inter alia also the Blue Arc takes its course for March 2015! Since the Blue Arc is broken downwards finally, it is likely to exert a strong resistance function. There, at 1222$, go into the 2nd short position at the permitted back test of the Blue Arc. Perhaps even 1245$ will be seen again for the end of March/beginning of April. There the 3rd short position is advised. SL is a monthly close above the Resistance Angle, mentioned several times.
Be a part of our exclusive sworn GUNNER24 Trader Community – now... I try to protect your wealth!
- with daily trades – quick, safe and profitable…
- in well-chosen precious metals, commodities, indexes, currencies and in the best stocks worldwide...
- in both rising and falling markets…
- with little use of capital…
Be prepared!
Eduard Altmann


