I think that the US markets have switched into a more extended correction phase now. Whereas the S&P 500 and the NASDAQ-100 have topped seeming to be through, maybe the Dow Jones will still have to produce a little higher high by the beginning of the week. But for the S&P 500 and the NASDAQ-100 I expect the confirmation of the new pullback phase by lower highs on daily basis next week:
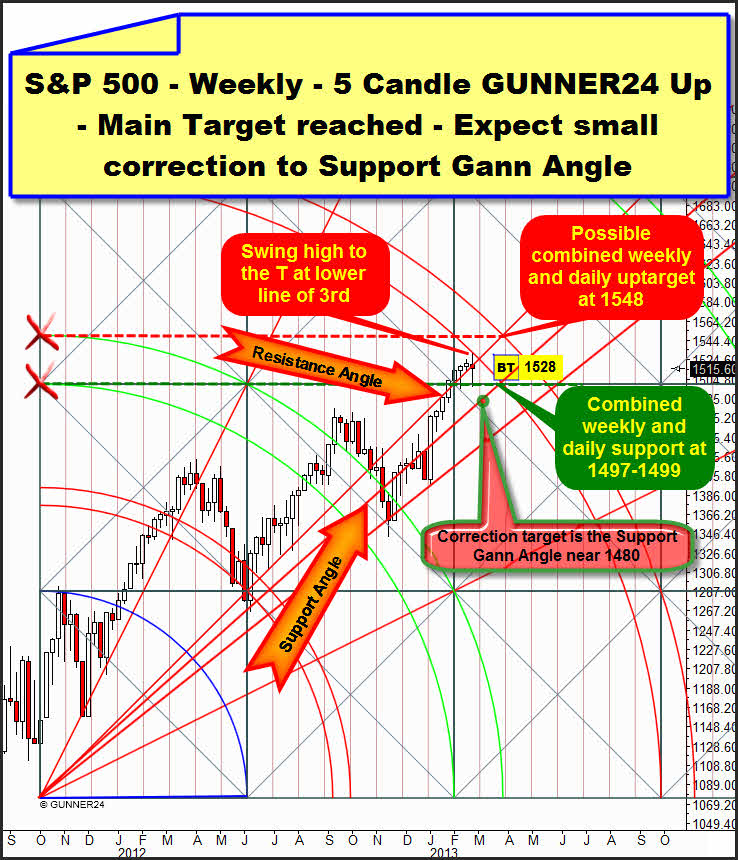
On Tuesday, for the first time the S&P 500 touched the main target of this uptrend that was prognosticated on May 20, 2012 already (!) - the lower line of the 3rd double arc. As last advised in the GUNNER24 Forecasts of February 10, at 1528 we covered the current S&P 500 monthly (+6%) and daily (+1%) long positions. In addition, at the Tuesday highs we closed the monthly NASDAQ-100 longs with a small profit.
The hefty reaction to the resistance of the lower line of the 3rd at 1531 is newly confirming the validity and importance of the weekly 5 Candle GUNNER24 Up Setup above. After reaching the highs, within two trading days the market dropped in a severe reaction to the combined weekly and daily horizontal support of 1497-1499. From there it ended up in a pretty significant rebound that wasn’t enough yet to maintain the actually most important Gann Angle.
I just called this angle a Resistance Angle because of its resistance functions expected in future. In the final effect the market is not only confronted with the long-lasting resistance of the 3rd now, but the Resistance Angle is also supposed to inhibit persistently rising prices.
From my point of view the market is likely to correct onto the support Gann Angle within three weeks. A daily close below 1497 will activate the next lower Support Gann Angle as the target for this correction, with target narrowly below 1480. Please gather more on this pullback scenario from the analysis of this daily time frame on the bottom!
==> Watch out: The expected long-lasting resistance of the 3rd double arc in the weekly time frame on the S&P 500 makes long-engagements extremely risky now for investors and those traders who are aimed at medium or long-term trades! Only the last gamblers, gamers and penny-pinchers are still long now. Even though it’s possible that a pretty harsh, quick exhaustion move up to 1548 (next higher super-resistance at the upper line of the 3rd) may happen, for the next weeks or even months I don’t expect that the 3rd can be long-lasting broken upwards on closing price basis.
That means concretely: At best a very long and persistent topping process is to come now that is likely to be dominated by the resistance of the 3rd double arc, so it goes rather sideways with down tendency for weeks on a high level.
Or respectively in the most brutal extreme case the potentially very strong and long-lasting temporal resistance of the 3rd double arc will force the market down now for months. The 3rd may lead so a mighty change in trend. Since the temporal resistance of the 3rd won’t expire before the autumn of 2013, very low prices may be the obligatory result – 13xx. As a matter of fact, I don’t really expect this scenario to happen…
The trading tactics for the coming weeks and months: In the current uptrend we GUNNER24 Traders won’t go long on monthly and weekly basis before this 3rd is overcome significantly on closing price basis. The next uptarget then will be the 4th double arc in trend direction, at about 1610. Till then we’ll trade the daily time frame long and short as well, depending on the daily signals.
Dow Jones weekly view:
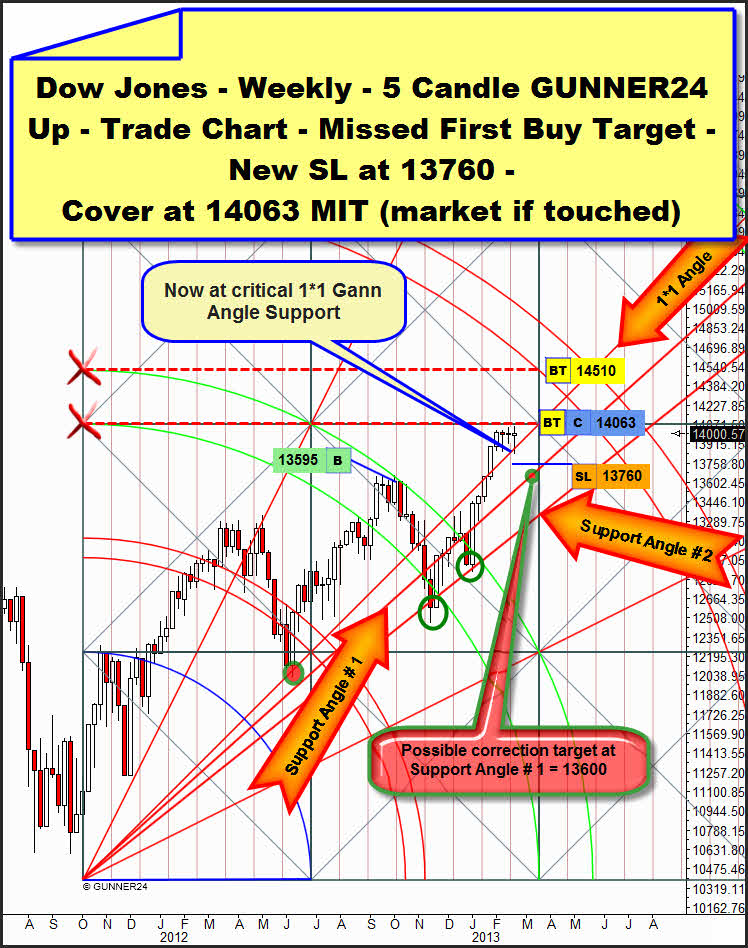
It’s not unusual that one of the markets lags a little bit or that it runs ahead. I think the S&P 500 and the NASDAQ-100 are ready for correction now. The Dow Jones, however, is not ready yet. During the last days right down to 5 index points it approached the important weekly horizontal resistance of 14063 where we wanted to cover our longs we bought at 13595. I mean it’s apparent that the market clearly respects this resistance magnet. But couldn’t it have done even those 5 points?
The relatively positive weekly close and the – still bullish – last weekly candle make me believe, however, that it wants to get swinging up to the 14063 and maybe a little bit higher before it turns down. Correspondingly, we’ll let in the market the sell-limit for the weekly longs at 14063. Nevertheless we are not going to take chances. We’ll ensure the profits putting now at 13760 an SL MIT (market if touched) into the market.
As the correction target – no matter whether the Dow has topped already or catches up next week – I expect the 13600 at the support Gann Angle # 1 to be seen rather in four than in three weeks…
Daily 9 Candle S&P 500 view:
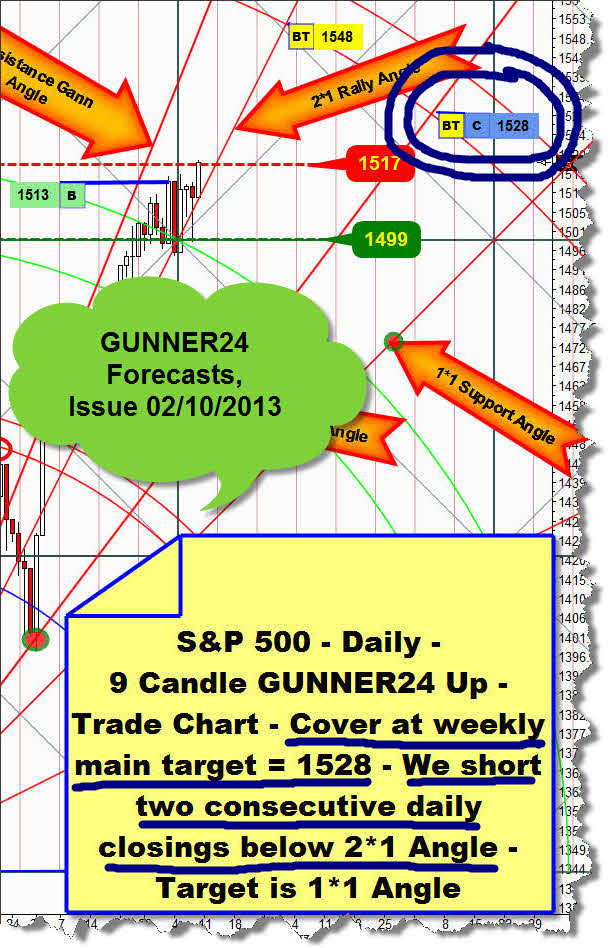
There is a lot going on in the actual trade-chart. First, as announced two weeks ago, at 1528 we covered our daily longs we had triggered at 1513 on February 01:
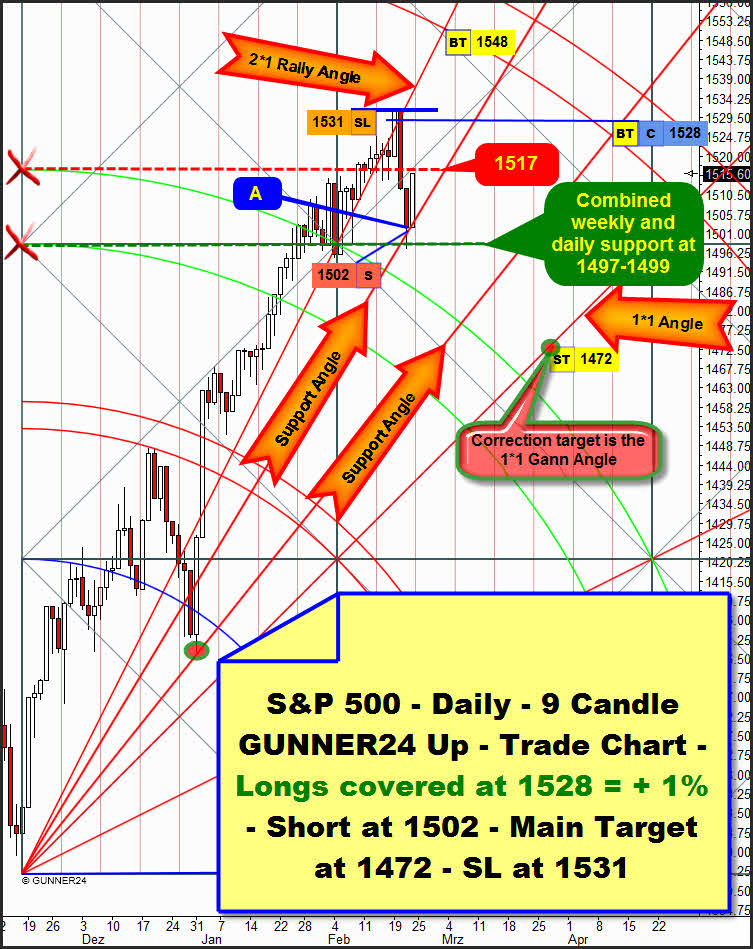
Furthermore our plan provided to short the second consecutive daily close below the 2*1 Rally Angle since only this combined closing signal would be the relatively sure confirmation for the correction wave 4 to have begun:
On Tuesday the longs were covered at 1528 MIT. A day later, on Wednesday, the supposed wave A of the supposed correction wave 4 began. Thursday closed for the second time beneath the 2*1 Rally Gann Angle – short at 1502. I suppose that the wave 4 is becoming a ABCDE correction pattern. Correspondingly, the market should be situated in wave B that shouldn’t correct above 1528. So a lower daily high should be underway now. Since the 2*1 Rally Gann Angle is broken finally now, according to W.D. Gann’s Gann Angle Trading Rules the next important Gann Angle which is the 1*1 is becoming the target of the current move. Correspondingly and taking into account the signals of the weekly 5 Candle GUNNER24 Up Setup for wave 4 I expect the 1472 to be the final target of this correction.
The SL for the shorts is the current swing high at 1531 MIT (market if touched). For if the supposed A turns out to be a bear trap, the thoroughly visible significant rebound from the combined daily and weekly horizontal support at 1499 will possibly have the force and the power to take at first the 1531 subsequently exhausting up to the 3rd double arc. Target in this case will be the combined weekly and daily resistance at 1548. That’s where at the latest the market will be likely to top out finally.
|
„As far as I know", the GUNNER24 Forecasting Method is the globally unique and only technical analysis tool that deals intensely with the comportment of the market at support and resistance marks being able to combine that with price predictions. You’ll learn everything on these really "secret" facts in the Complete GUNNER24 Forecasting and Trading Course. Order now!
Be prepared!
Eduard Altmann


