Considering my own mentality I think there is nothing more unpleasant for an educated trader than betting on long close to a possible top. While the entire trader community prognosticates a reversal day by day on the basis of the wave-counts and the overbought indicator situation – while the sentiment is absolutely bullish - whereas you actually know that you can only make real money in the stock market acting against the action of the crowd because they are always caught on the wrong foot sooner or later… best you can do is constantly recite the motto "the trend is your friend", confide your system, set narrow stop-losses or adjust them respectively every single day and – stout-heartedly here we go!
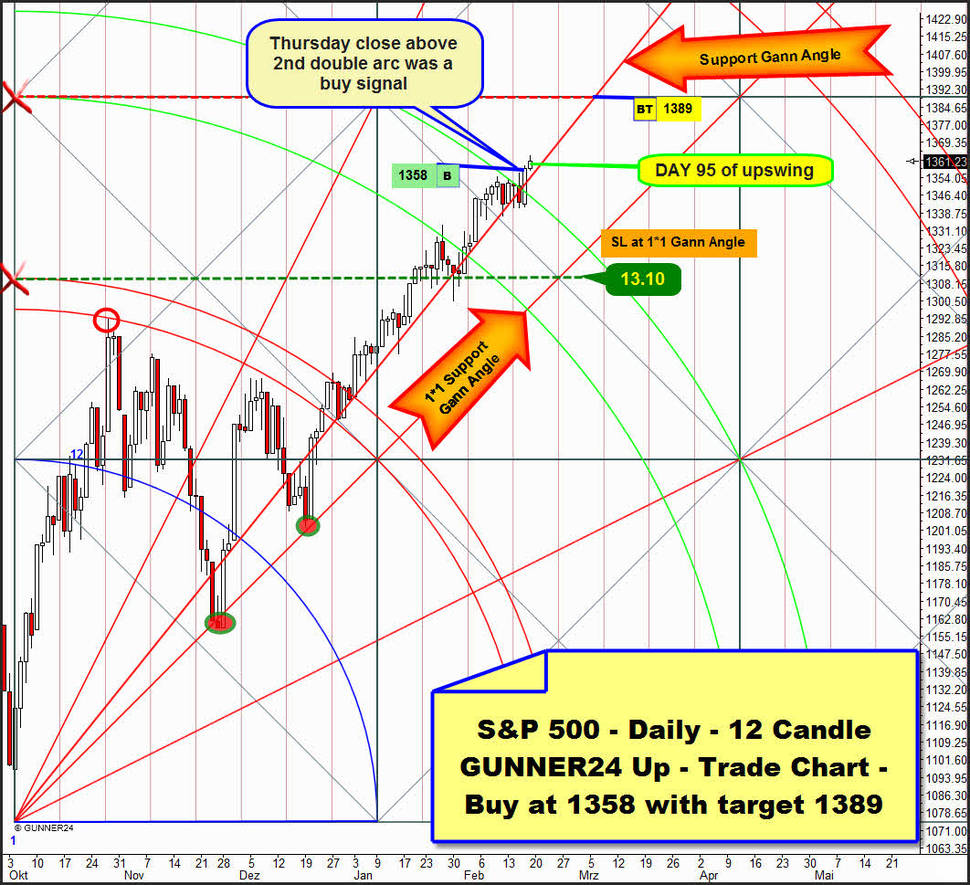
On the basis of the S&P 500 analysis of last week, on Thursday we bought the unequivocal break of the 2nd double arc:
Long-entry was at 1358, first target will be the next visible horizontal resistance at 1389. Since the break of the 2nd double arc on daily basis indicates a 70% of probability that the third double arc will have to be headed for, the main target is actually to be expected at 1400 through the end of April if the market – following the 1*1 Gann Angle – orderly heads for the 3rd double arc. In addition the Fib count is temporally backing the ascent until May. I mean, as the high of the 89th trading day was overcome we’ll have to take into consideration that the upwards trend might last until the 144th day = beginning of May 2012. So, shall we say again: "sell in May and go away!"?
But as analyzed frequently – here and here – in my opinion the market is in its exhaustion move being able/supposed to head for the 1400 or in the NASDAQ-100 the 2640 respectively, as early as by the end of this month. Since - as a rule - the exit marks in an exhaustion move can only be calculated accurately for each completed trading day anew and since at the end of an exhaustion some intraday reversal candles may form that are uncomfortable and extremely wide we’ll cover by reaching the "safe" 1389.
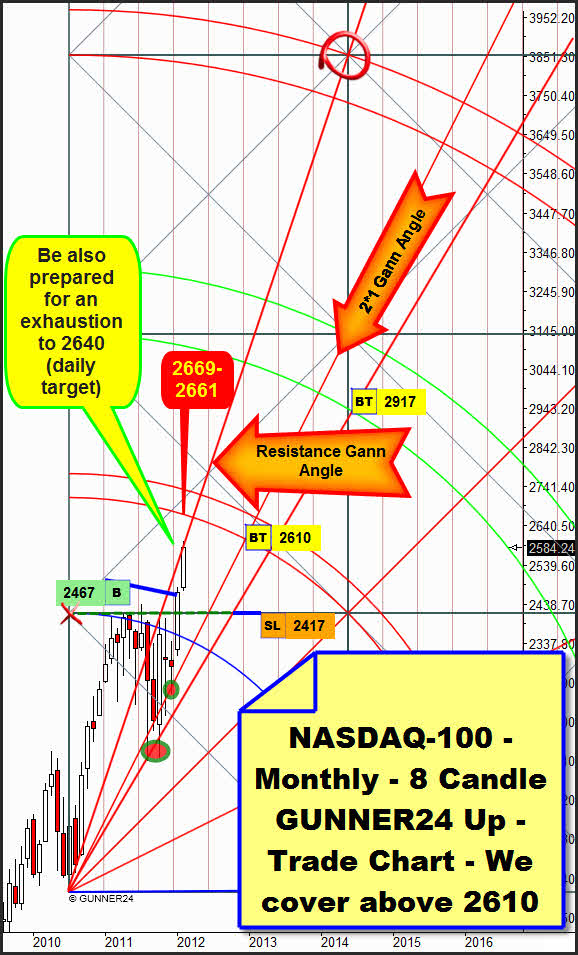
As also announced last week we did a long-entry on daily basis in the NASDAQ-100 because the week closed above 2560. Buy at 2584. Main target is at 2640, SL at 2497.
Considering the monthly 8 candle up of the technology index we’ll see one thing clearly: The lower line of the first double arc is unambiguously the target of this monthly move.
Well, January produced a double buy candle. The Blue Arc and the upper limit of the first square were broken in one go. That’s a monster buy-signal. See the analysis here. Target thus is the lower line of the first double arc. It’s at 2669 for February 2012. But that cannot really be true, can it? It would be too extreme, and it could only be reached if next week closes far above 2640. On this score, please pay attention to the actual resistance Gann Angle. A close above 2620 and so above the resistance Gann Angle next week would clearly point to 2661 (lower line of first) for March 2012. If February closes above 2610 we’ll cover the monthly position!
When there’s a bang it’s a big one – in fact upwards… Silver month check:
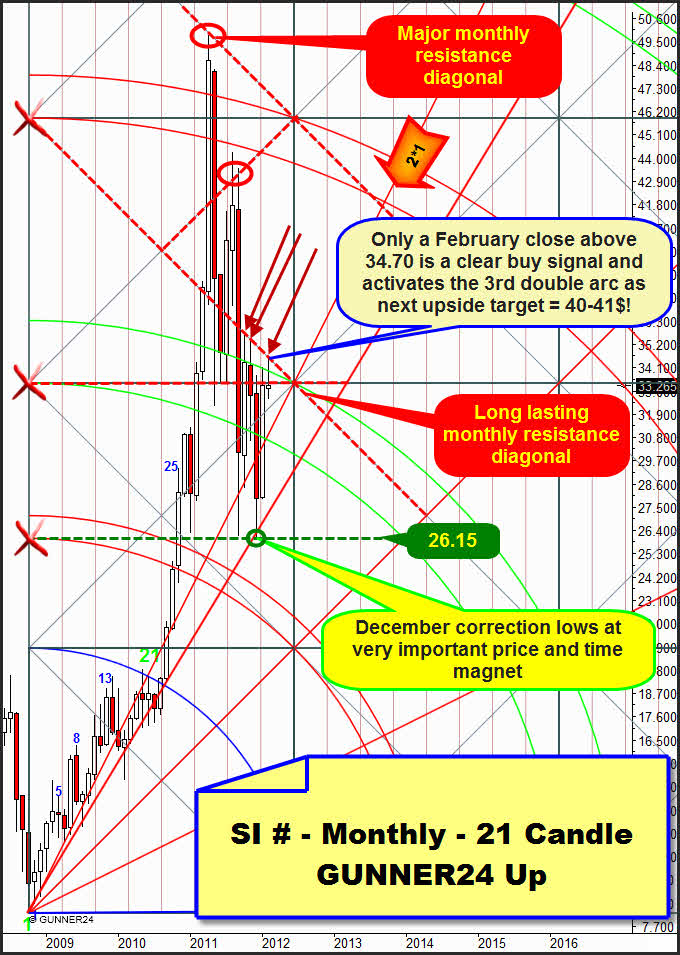
The last time we considered silver was 12/30/2011, one day after reaching the 2011 year-low. The evidence has been confirmed that the low represented a strong support: Unbraked silver went from 26.15 on 12/29/2011 until the actual swing high of 34.52 on 02/08/2012. Since then silver has consolidated this vehement ascent.
On monthly basis, with this high of the week before last an important monthly resistance diagonal was reached. In the so far unpublished monthly 21 Candle GUNNER24 Up we see that the tops of the months of October and November 2011 were formed at that strong resistance diagonal as well as now in February 2012. Actually silver continues being quoted below the strong resistance diagonal that represents the upper limit of the just passed square.
Moreover silver keeps staying in the sphere of influence of the 2nd double arc that impedes further price rises at the moment for actually it is - visibly for all of us - forcing the candles downwards, according to its direction. In fact, exactly at the upper line of the 2nd double arc A) the October 2011 close, B) the November 2011 opening and C) the January 2012 highs were marked.
In the setup is most conspicuous that silver orients itself by the important horizontal and diagonal supports and backings in a frequency above average. The hits are marked with green/red ovals and arrows, as mentioned that’s very flashy and unusual from my experience.
Considering silver now as far as signal-giving, atmosphere and chart technique are concerned, in spite of the sparkling rally of the last weeks, seen in the medium term we’ll rather have to expect more negative things. In objective consideration, at the moment there are three forces pressing on the price. Firstly it’s the monthly resistance diagonal, secondly the downwards course of the 2nd double arc and thirdly the upper horizontal square limit. In addition there are lower monthly highs. This collection of downwards forces and temporal resistances may press silver back down to 26 and even lower. In the worst case silver may follow the 2nd double arc downwards for the whole year.
But: Considering the performance at the important double arcs in correlation with the GUNNER24 Trading Rules we’ll get a completely different picture! It’s a positive picture! It allows us to expect that until 2012 at least the 3rd double arc at 40-41$ is going to be headed for again!
Firstly silver closed above the 3rd double arc in April 2011. That’s a clear buy signal – even though it’s long-term because the 4th double arc will have to be headed for with a 70% of probability consequently, in the trend direction (not visible in the chart above – the 4th is lying at 60-57$!).
Secondly silver closed below the 2nd in December, in fact. Technically that’s a sell signal. But now January closed again within the 2nd thus denying the December sell signal.
Thirdly the January 2012 close within the 2nd prepares a breakout of the second. That’s the actual valid signal.
Fourthly the actual signal will be confirmed if silver closes above the 2nd. For February 2012 that would be the case at 34.70!
Fifthly the rise will be brutal – quick and tough – it’s just typically silver. The reason is: There are only gray acceleration fields in the square above the silver suggesting an acceleration of the existing trend (page 48, Complete GUNNER24 Trading and Forecasting Course).
This issue was hung on "forced to buy". In the cased of silver you may/have to implement the above analysis as follows: A) A monthly close above 34.70 in February (the 2nd double arc would be clearly broken upwards) has to be bought with target 41. The instruments are futures, CDF, ETF, options. The target is likely to be reached before May 2012. SL is a monthly close below the 2nd double arc at 29.50. B) Below 30$ we should grab physically again accumulating bit by bit if the consolidation wants to keep on 1-3 more months. The 2nd double arc will be broken upwards at any rate. Minimum target for the coming recuperation will always be the 3rd double arc. It will either be at 41 in May or at 37 later on in the year!
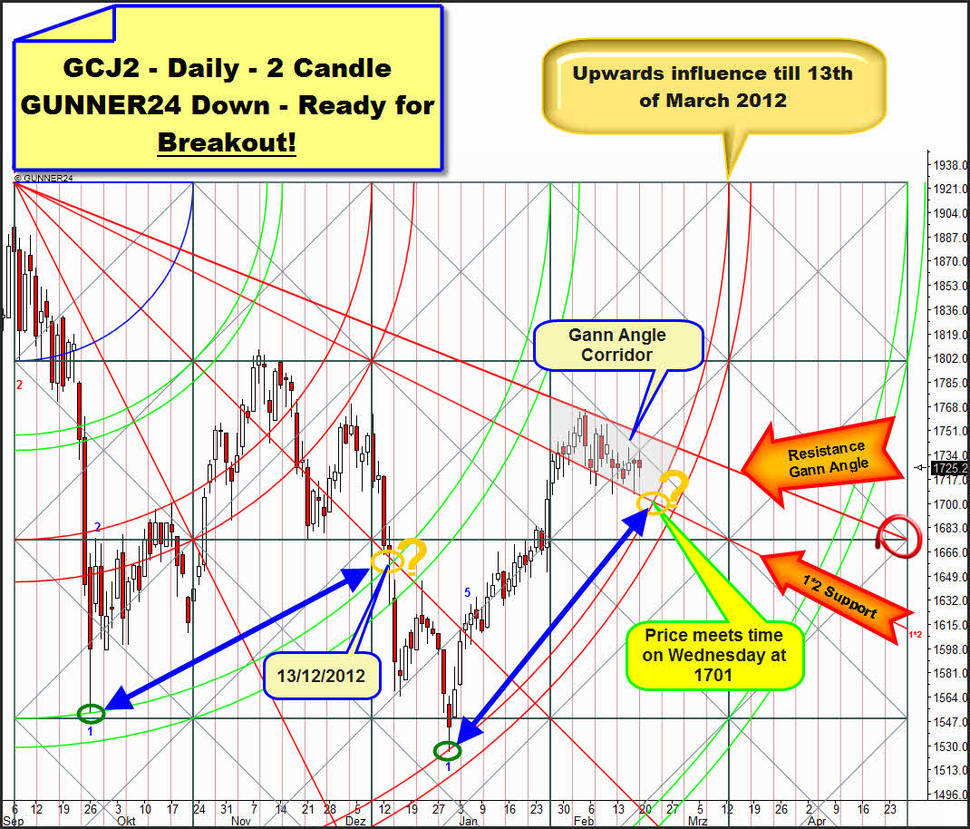
On Wednesday the consolidation in gold may end at 1701 ringing in a simultaneous new approach to the break of the 34.50 resistance in silver:
Considering the daily 2 Candle GUNNER24 Down that starts at the all-time high we can make out very well how organized and well-ordered gold is heading to the 4th double arc within the actual Gann Angle corridor. By the sloping channel - that is clearly interpretable as a bullish continuation pattern since a consolidation in the highs is taking place – it is reducing step by step its overbought condition only requiring a temporal impetus for the next serious rally attempt. That one will be lying at 1701 next Wednesday.
Then gold will reach the upper line of the 4th double arc that might provide this impetus such as happened on 12/29/2011 when gold met the upper line of the 4th for the first time thus triggering the first leg of the actual rally. Technically we may work on the assumption of a new rebound from the upper line of the 4th since it’s a matter of only the second touch with this line. According to W. D. Gann in case of the second touch with a magnet we can always assume that the same reaction as in the first one will newly take place. Nevertheless caution is appropriate because on 12/13/2011 the upper line of the 3rd did not resist the second test, and there the market accelerated the downtrend.
For safety we’re not going to buy the first contact with the upper line of the 4th but the close of the first reversal candle after having recognized that the 4th can be expected to resist or might have triggered a rally attempt.
Register with our GUNNER24 Gold Trader now. That’s where we oversee the optimal entries and exits for you. Especially in market situations where many factors have to be considered the Gold Trader is backed by the additional GUNNER24 Signals based on the combined 1,4,8 hour and daily setups to catch the optimum entries and exits.
The GUNNER24 Gold Trader will provide you with the critical knowledge you need to forecast and analyse the precious metals with the GUNNER24 Forecasting Method. All the GUNNER24 Trading Signals you receive real-time are based on the actual Gold and Silver Future. The NEW GUNNER24 Gold Trader is a must for every actively working investor and trader who wants to trade successfully in everyday trading. The insights you receive from the head trader Eduard Altmann (and discoverer of the GUNNER24 Forecasting Method) are truly amazing sometimes. I promise!
Click the button below and order the GUNNER24 Gold Trader - $39.90 US a month. For 201 members and up - $49.90 US a month.
Be prepared!
Eduard Altmann


