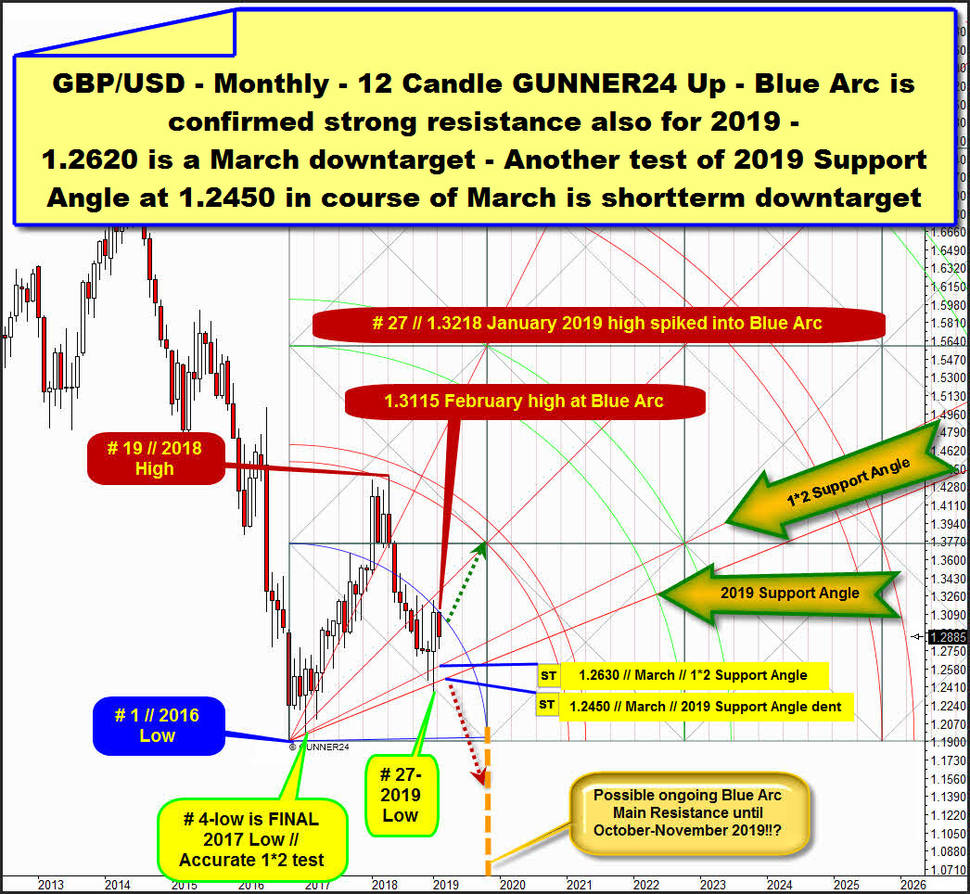
First, we focus on the Big Picture of the GBP/USD currency pair, starting todays view with the for years most determining valid monthly GUNNER24 Setup that begins to measure initial up impulse at received final low of the year 2016. There the underway multi-year countertrend within overall bear market began to evolve. As of Friday close, one pound was equal to 1.2885 United States dollars:
Setup starts measuring upwards at # 1 // 2016 Low and quite properly depicts all the most influencing Big Picture Resistances and Supports!
The countertrend that began at # 1 // 2016 Low finally topped nearly exactly at lower line of 1st double arc uptarget of monthly 12 Candle up. This # 19 // 2018 High has worked off big natural GUNNER24 Countertrend Uptarget resistance in a very negative way and the brutal 2018 downtrend year was triggered by the lower line of 1st double arc threshold.
==> Strong bear market started at 2018 High!
Signal strength and validity of 12 Candle up is confirmed cause also importance of first square line is proven by price through 2018. We observe some month highs and lows, also some month closings and openings there at previous initial monthly horizontal support. In course of 2018 the initial Blue Arc support was re-broken to the downside which was major 2018 sell signal and finally the pair bottomed within bear market at January 2019 Low, 27th month of countertrend, which spiked below A) 1*2 Support Angle and B) 2019 Support Angle. See, that these both nearest important Gann Angle supports have been defended on monthly as on yearly closing base and these rising supports triggered an upmove and January 2019 bullish reversal candle.
But January reversal and actual 2019 top made at 1.3218 just was strong enough to test and dent Blue Arc from below. January 2019 close was not strong enough to re-conquer the Blue Arc resistance on monthly closing base. Then..., this month February 2019 top with a 100% accuracy tested Blue Arc from below. And this backtest of important future arc resistance triggered renewed bear forces. Cause February 2019 candle - still in time - is a strong red one which started to turn red at Blue Arc backtest from below we can state that falling Blue Arc still acts as strong month high resistance. And for sure it brakes the pair also on yearly base up to day.
Blue Arc continues to radiate bearish pressure. Strong bearish pressure. February high, made at 1.3115, likely has hit a yearly resistance from below this price offers itself as the most natural and obvious SL for a GBP/USD short position.
This year high as small lower February high visibly bounced from confirmed Blue Arc resistance and this offers the next test`s of 1*2 Support Angle and/or 2019 Support Angle, respective the very serious backtest of current 2019 low (1.2373) environment in course of the coming weeks and actually until the completed Brexit maybe, that is scheduled for March, 29. Then Brexit possible important turn date could change or force the running trends.
No one knows exactly what happens with the British pound near Brexit time magnet, but we should use the Blue Arc above as most important future signal trigger. Hmm, usually - cause of confirmed Blue Arc resistance influence on monthly. resp. on yearly base - pair could continue to be exposed massive bearish forces until the Blue Arc expires sometimes in course of October to November 2019.
This arc resistance time signal would actually mean that GBPUSD has to go lower as at # 1 // 2016 Lows... ==> Think we have a 60% odd that pair has to deliver lower bear market lows in further course of 2019 after a March, 29 Brexit. Former price behavior at Blue Arc is signaling that outcome or likelihood.
On the other hand the very first future monthly close higher than nicely-confirmed falling Blue Arc before October-November 2019 should be a confirmation for a strong triggered bull cycle which should overrun everything. So perhaps a March Brexit will be bought with both hands, or "Buy on Facts" rule comes true, and pair rallies massively into 1st double arc upmagnet in further course of 2019 = green dotted arrow outcome, that has a 40% odd or so).
But before the Brexit comes due, pair should continue to drop into that date.
As I said above:
Pair looks poised to test back 1*2 Support Angle at a minimum into Brexit. ==> 1.2620 is worked out possible important downtarget for the March 2019 candle!
And maybe also sometimes in course of March 2019 the rising 2019 Support Angle could be tested back close to this year low environment!
==> GBP/USD shortterm downtarget is the 1.2450 area for March 2019. This is well identifiable combined weekly and monthly GUNNER24 Support Magnet. Means, 1.2450 actually is a strong attracting price for the at 2018 Top started downer:
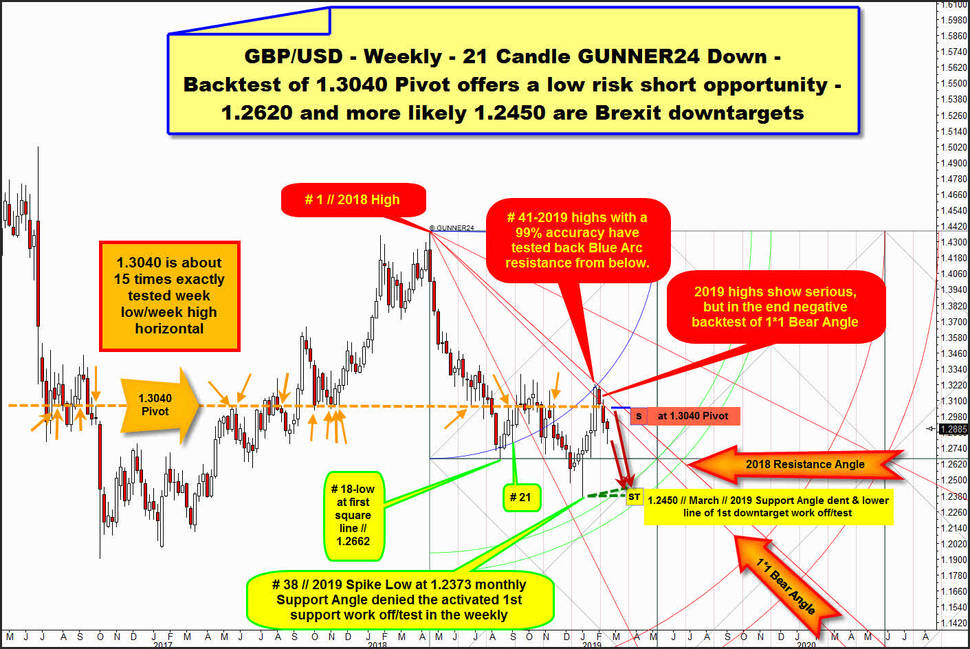
Bear cycle through weekly lens of course also begins at the final high of 2018, or # 1-top price. Advise entire weekly downtrend is measured best with above overlayed "classic" 21 Fib number down. See that important low of downtrend week No. 18 was classic backtest of first square line which runs at 1.2662 for the entire future. Setup placement is additionally confirmed because the in course of Januray made 2019 highs in course of downtrend week # 41 with a 100% accuracy have tested initial Blue Arc resistance from below, followed by small lower February lows that found 100% accurate resistance at natural Resistance Angle out of 2018 High.
==> GUNNER24 delivers that 2019 highs very unsuccessfully have tested back 1*1 Angle that springs directly from important countertrend high of 2018.
==> 2019 highs found A) weekly resistance at most important countertrend target that is always the 1*1 Angle, and at same time B) found weekly resistance at rising Blue Arc rail from below. And this negative backtest of strong braking weekly resistance magnet at 2019 highs not only tested a weekly magnet, but also monthly 2019 Blue Arc resistance. Means: 2019 highs likely are next important lower countertrend high of GBPUSD on monthly and weekly base and pair is now again a strong short candidate until proven otherwise.
Think selling short at 1.3040 Pivot is a relativ safe trade. 1.3040 Pivot which is an extremely well-tested, confirmed future horizontal, should now again offer strong future resistance! For the next week candle 1.3040 Pivot forms interesting future resistance magnet together with 1*1 Bear Market Angle coming out of 2018 High!
==> Cause of all the worked out bearish signs in the monthly and the weekly chart, we could sell-short the next possible test of the 1.3040 Pivot.
==> Weekly time frame offers activated GUNNER24 Downtarget at around 1.2450. There for the course of March runs the upper line of 1st double arc which test or work off was denied at this year made # 38-low (at 1.2373). Usually pair has to test that possible strong downtarget magnet in trend direction. And the trend is down and therefore bounces should be sold.
Weekly upper line of 1st double arc together with monthly 2019 Support Angle forms attractive future price magnet at 1.2450 in course of the March 2019 important time magnet.
==> GBP/USD shortterm downtarget is 1.2450/March 2019. 1.2450 actually is a strong attracting price for the monthly downtrend which pair might work off finally towards scheduled Brexit, 29th of March 2019!
SL for the trade should be placed at 1.3125. This is 7 pips above 1.3218 year 2019 High!
Be prepared!
Eduard Altmann


