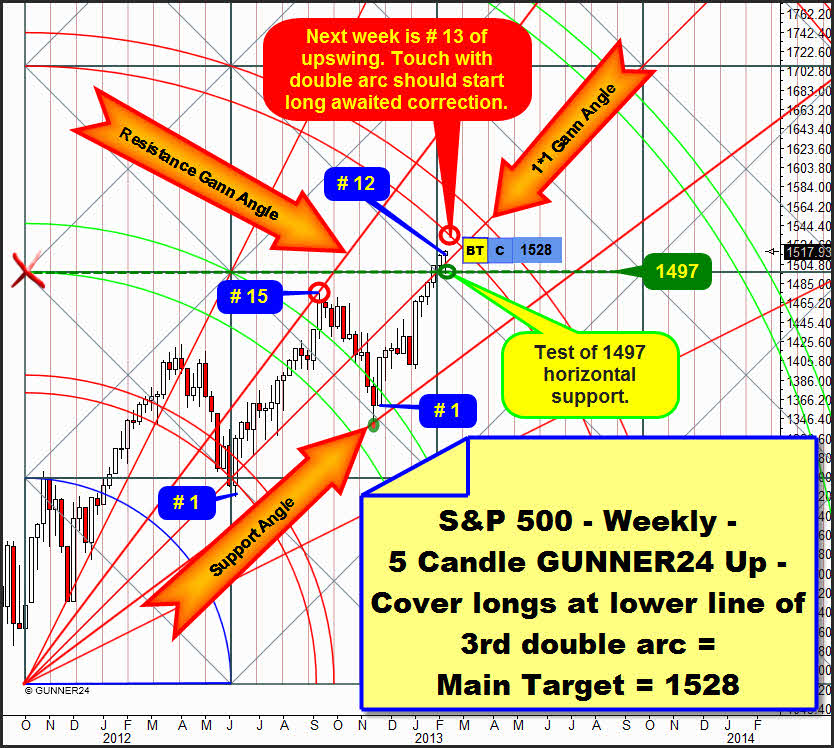
The last trading week was mainly marked by a narrow consolidation at the highs before the US stock markets succeeded in climbing to new uptrend highs on Friday. So the positive sentiment is keeping on being expected to inspire the markets next week as well and carrying the S&P 500 to its weekly 1528 main target at the latest till Thursday 02/14/2013. At 1528 the S&P 500 is supposed to turn down finally flowing in the long expected corrective wave 4:
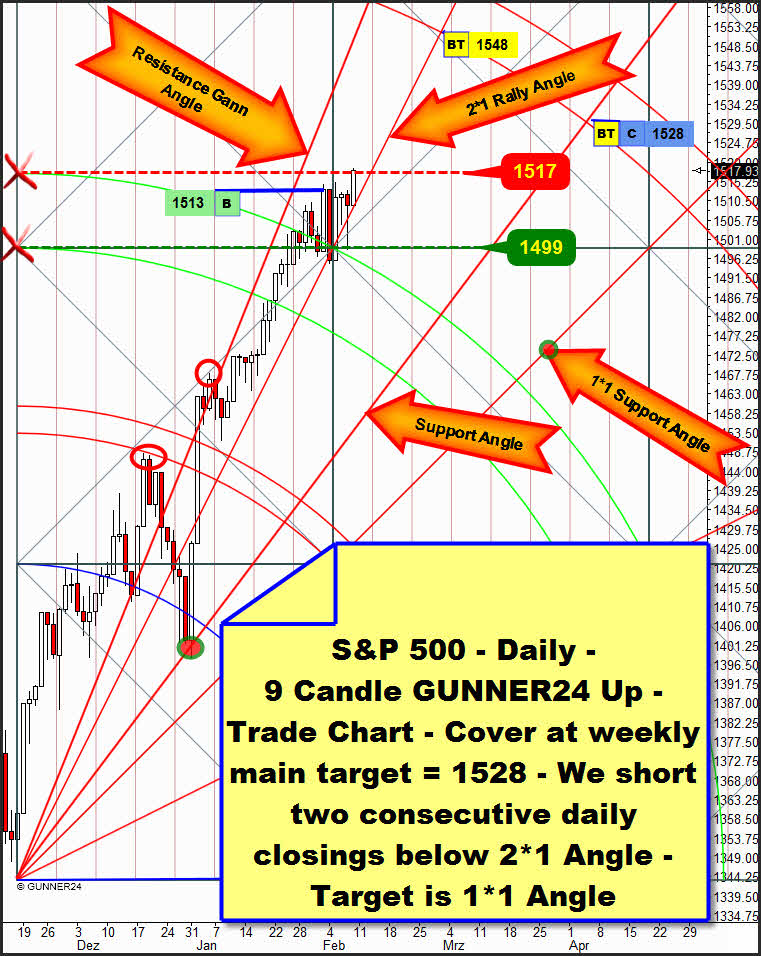
In the daily 9 Candle GUNNER24 Up Setup we make out that after the last buy signal – the clear daily close above the 2nd double arc the market consolidated beneath the 1510 being the most important February 2013 GUNNER24 Monthly Resistance. The iv of the impulse wave 3. Within this consolidation last Monday/Tuesday the 2*1 Rally Gann Angle as well as the 1499 horizontal support were tested. The test also dipped into the 2nd double arc, but the price was rejected immediately. Thus the now existing, long-lasting support function of the 2nd double arc is being confirmed. I.E. the 2nd is expected to exercise a strong support function in future, too… technically daily closings within the 2nd double arc are hardly possible any more, therefore the correction wave 4 is supposed to go downwards above the 2nd in a well-mannered way…
After being worked-off the 1528 we’ll short the market on daily base after two consecutive daily closings below the 2*1 rally Gann Angle. First target will be the 1*1 Angle at 1472.
How important it will be not going short before two consecutive closings below the 2*1 is shown by the last Monday close. It was underneath the 2*1 Angle. Once is not sufficient… a false signal…
By the successful test of the 1499 support horizontal the v of the impulse wave 3 began. On Friday the tight consolidation area at the highs was abandoned. The narrow Friday close above the natural horizontal resistance at 1517 is indicating that the 1528 will have to be worked-off next week. For above the 1517 up to the 3rd double arc no daily resistance exists any more. If the market wants to go on following the 2*1 Rally Gann Angle, merely theoretically the market may exhaust up to the 1548. But I doubt that very intensely because first:
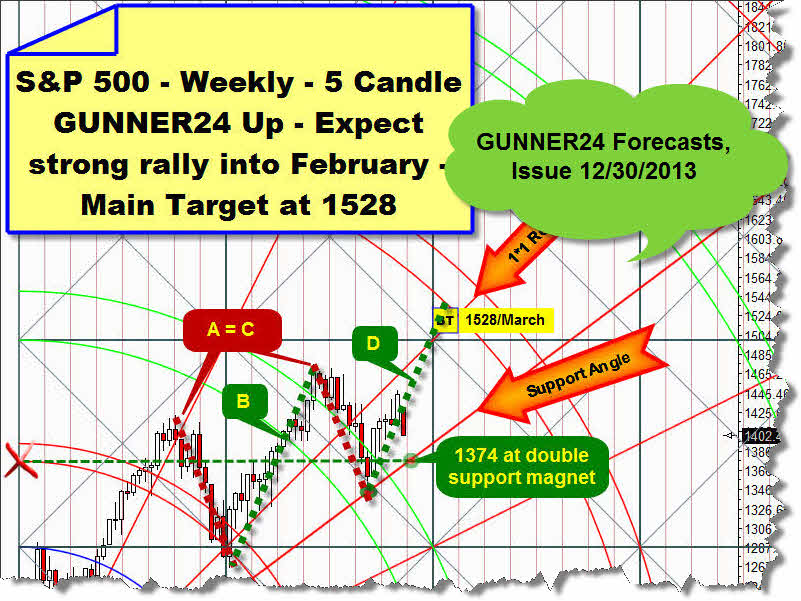
The weekly pattern that was identified by the end of December 2012 is technically not much use any more.
Then I supposed that D would be going to perform just like B in terms of the angle and the range. Well:
The S&P 500 is likely to deliver exactly where it was predicted to. The lower line of the 3rd double arc in the weekly setup above was really to ring in the change at 1528. The weekly Fib Count is indicating us that next week the 13th week of the actual weekly swing will be due. Since the markets love to ring in significant changes at Fibonacci numbers, this timing aspect is going well regarding the 1528. But the last weekly upswing – the B – lasted 15 weeks… what would permit the 1548 out of the other important weekly timing aspect…
But we are not going to take this chance. The 3rd double arc in the setup above is a very strong natural resistance that is starting at the lower line of the 3rd double arc at 1528. The threat of a correction is too large to be obliged for taking along this last snippet up to 1548. We’ll cover all the open US stock market long-positions we are in:
The open daily S&P 500 (entry at 1513) and monthly S&P 500 (entry at 1440) by reaching the 1528 MIT (market if touched).
By touching the S&P 500 the 1528, also the open monthly NASDAQ-100 long-position (entry at 2772 will be covered.
The open weekly Dow Jones long-engagement (entry at 13595) will be covered if the Dow touches the 14063 next week. May I refer you to the detailed analysis of last week on this Dow Jones trade?
Both precious metals can be touched on pretty concisely today. First, both are infinitely boring, sideways and slow, and secondly I believe that there won’t be a change on this topic before the Smart Money decides to top out the US stock markets.
Well, anyhow I suppose this top to happen next week. That’s all on timing. Movement in gold and silver is to be expected. The big question for me is this: Will the Smart Money let newly fall gold and silver in the tide of the due US stock market correction? This would be my advice, where I’m tending to, with a 60% of probability – Or: is fresh money going to flow into those two underperformers being dissolved the existing triangles upwards (a 40% of probability)? This is all completely subjective...
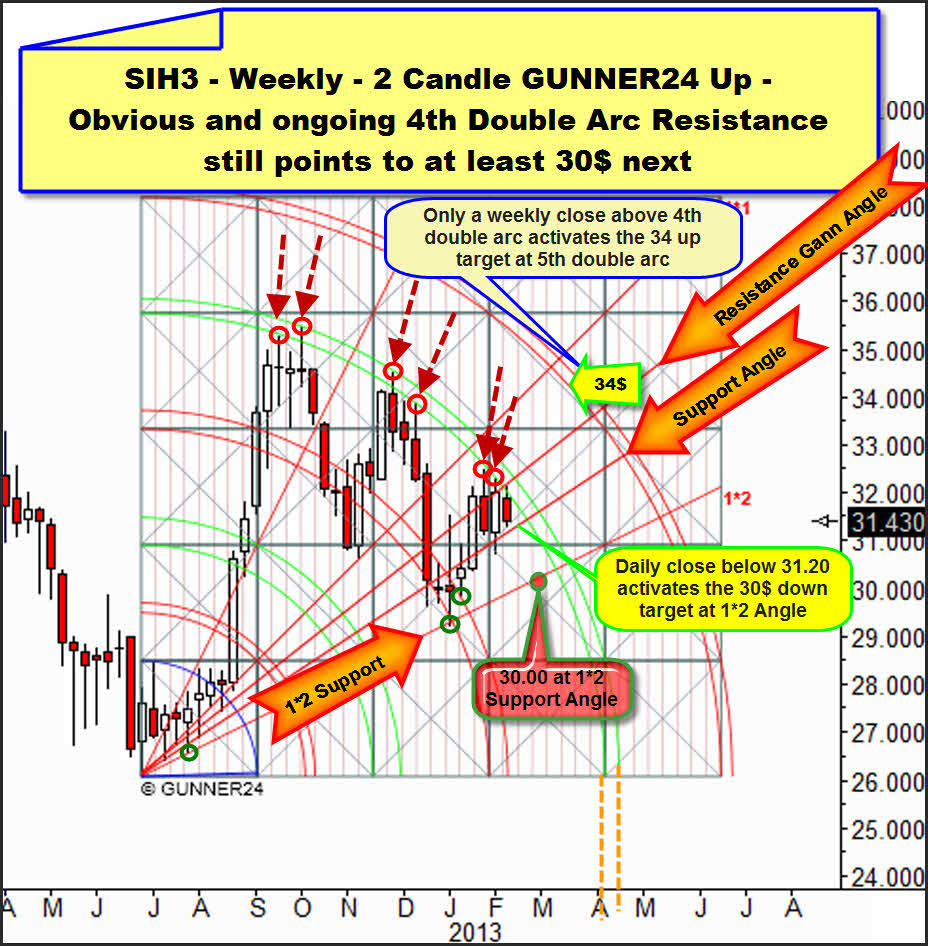
So my view is rather a little bearish. The reason is the 4th double arcs in the dominating weekly setups. Both metals are being slowed down and kept back by the natural resistance of these 4th double arcs. My view is rather bearish because experience has shown that it is much more difficult for a market to change the trend than to keep it.
In silver the resistance of the 4th is that obvious, so I’m still thinking that the weekly 1*2 Support Gann Angle will have to be headed for again before the 4th can finally be broken upwards. This would be the third test of this angle, and technically the third test should have to pass successfully as well. The rebound from this 1*2 might result in overcoming the 4th finally.
Completely glaring would be the thoroughly existing possibility that silver – and thus gold too – continue going down through April, when the temporal influence of the 4th double arc ends. In that case, the 30 would naturally be just a layover to the new 26…
Next week a daily close below 31.20 would activate the 30! But if silver finally achieves a weekly close above 32.20 (perhaps because the Smart Money is going soon into gold and silver) the 5th double arc and the 34 will be on the agenda.
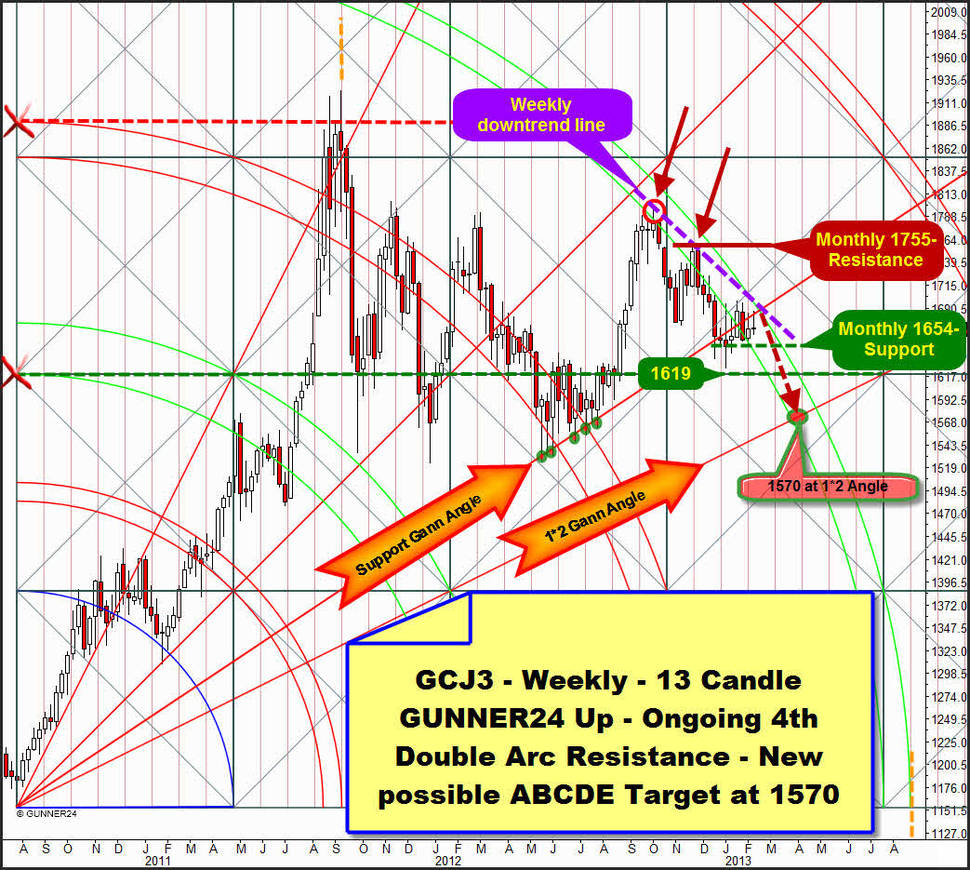
During the last three weeks gold was even more boring than silver:
It is still trading within both lines of the 4th. I think it will head for the 1685 until the middle of next week. That’s where it will meet the weekly resistance trendline combined with the upper line of the 4th where the decision will be made, where some volatility enters in the market. As mentioned, my advice is rather the 1570. A) Because the angle that above is still called "Support Gann Angle" hasn’t been able to be re-conquered for weeks actually exercising strong resistance already and B) The 4th is exercising visible resistance function and C) In terms of patterns we’re undergoing a consolidation at the lows. And the old trading rule reads: "Consolidations at the lows break to the downside".
But if gold closes above 1715 next week, the 1755 will be the next target.
In these whipsaw markets of the last weeks that might confuse any trader thus leading mercilessly to burning the trading account the professional signals have got their special importance. You get them in the GUNNER24 Gold Trader!
You best register with our GUNNER24 Gold Trader now. That’s where we oversee the optimal entries and exits for you. Especially in the difficult market situations where many factors have to be considered the Gold Trader is backed by the additional GUNNER24 Signals based on the combined 1, 4 and 8 hour setups to catch the optimum entries and exits.
The GUNNER24 Gold Trader will provide you with the critical knowledge you need to forecast and analyse the precious metals with the GUNNER24 Forecasting Method. All the GUNNER24 Trading Signals you receive real-time are based on the actual Gold and Silver Future. The NEW GUNNER24 Gold Trader is a must for every actively working investor and trader who wants to trade successfully in everyday trading. The insights you receive from the head trader Eduard Altmann (and discoverer of the GUNNER24 Forecasting Method) are truly amazing sometimes. I promise!
Click the button below and order the GUNNER24 Gold Trader - $39.90 US a month. For 201 members and up - $49.90 US a month.
Be prepared!
Eduard Altmann

