With a 90% of probability, this newly started uptrend by the Gold and Silver Miners is going to represent just a correction of the overriding bear market in the greater picture – the monthly time frame, but it may thoroughly last 10 months, perhaps even 1 year.
This issue is mainly dedicated to the purpose to work out the 3 possible and thereby likely attainable uptargets of this newly started countertrend in monthly time frame according to the factors time and price, using the example of the reference index HUI (NYSE Arca Gold BUGS INDEX).
To comprehend and internalize what’s happening with the Mining Stocks and what’s pending for the near future we’ll have to get a feel for what has happened.
In March 2015 (free GUNNER24 Forecasts, issue 03/29/2015), we realized that the HUI – then trading at 166 index points – was still to fall into its bear low down to 105 points. Then, the bear low was terminated to be reached between July and October 2015.
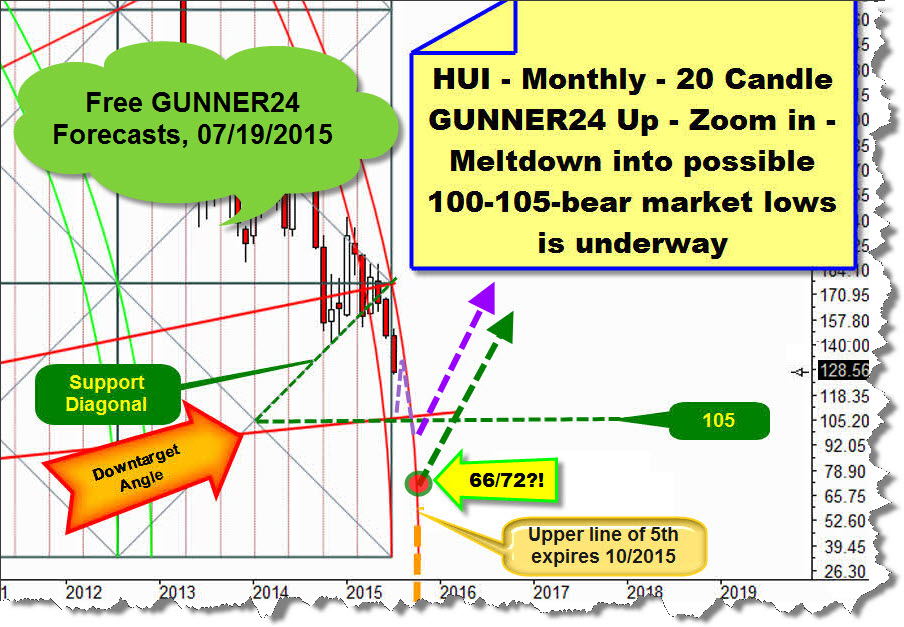
At the end of August 2015 (free GUNNER24 Forecasts, issue 08/23/2015), I made clear that a "last" HUI meltdown into a bear market low was underway technically having to come to an end at 100-105. In case the 100 couldn’t bear up, as to the worst scenario the HUI might have fallen down to 66/72 into October 2015:
Yet the most likely option was that the 100 would have held getting started from there a strong upmove that would have headed for higher resistance magnets in the range of 180-200 pts. (purple + green arrow path).
Let’s go on now. Why did the 100 bear up? Why didn’t the current upmove already start in October 2015 but just a short while ago, mid-January 2016?
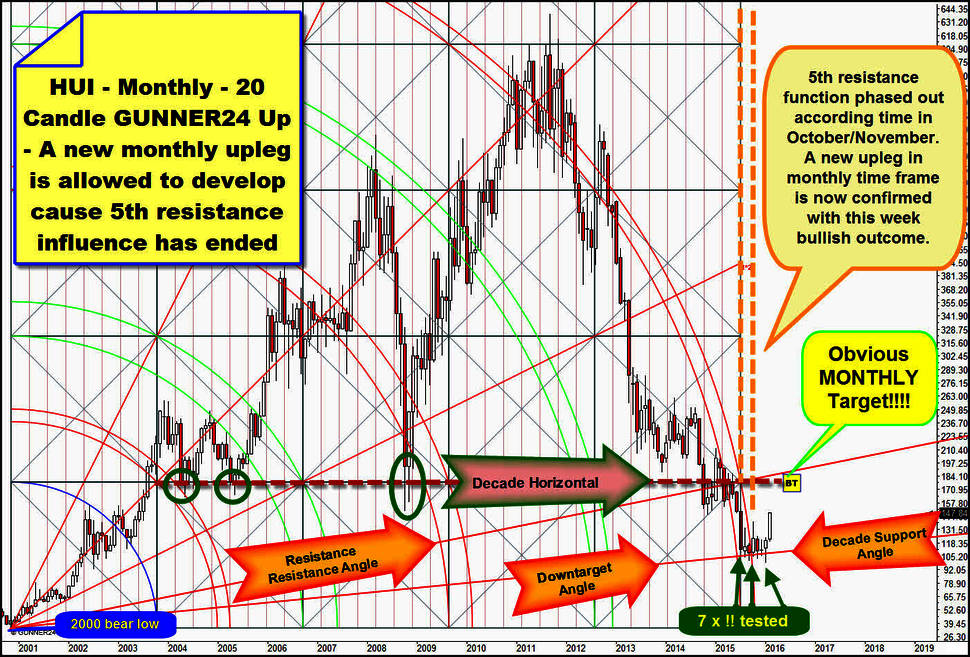
Above, you see the very most important HUI up setup in the monthly time frame. It begins at the bear low of the year 2000 measuring the very first 20 candle initial up impulse that started at the 2000 bear low.
From a determined moment, the HUI had to fall secured into the Downtarget Angle looking for its bear market low there and possibly finding it because since the ATH of the year 2011, it was under the strong resistance influence of the downwards-directed 5th double arc.
Since the 5th double arc was pre-defined as a possibly important resistance magnet springing from an initial up impulse of the period 2000 to 2002, it was matter of a decade resistance. More than a decade ago, the origin of the 5th double arc was pre-defined as future resistance by the large mass of traders of that time.
The upper line of the 5th intersected the time axis pretty exactly in October 2015. As it were, it expired there concerning the time factor. So we realize that the October 2015 candle was a good +month already, then the best +month for more than half a year. As well, the October 2015 candle shows a long upper wick, then the longest upper wick for more than 1 year. I think, thereby the decade resistance of the 5th double arc really did expire sometime in October 2015.
No substantial rally started however, resp. no monthly up-leg did, even though a decade resistance expired in terms of time. Why? I think the answer is in the magic of the round 100! The 100 was certainly the item that had to be reached and worked off! That was indeed the final target of the past bear! The 100 was reached on 01/19/2016, and not before that – in my view – the new bull market in the monthly time frame was allowed to get started.
Now we come to the psychology factor, to the now relieved tension and the visible upwards pressure of the last 3 weeks: Nearly for 5 years, the HUI had had to fall permanently because the 5th double arc – a decade resistance – pressed and forced it down to the 100.
During the last 4 years, a really enormous tension had grown that is relieving now. That’s why it is going upwards at present that mightily fast.
In addition, the aspect of the certainty that the lows are ultimately brought in is now taking effect to the buyers. We just have to consider the comportment of the last 7 monthly candles at the Downtrend Angle. We count 7 (!) tests at the Downtrend Angle, 7 successful ones because none of the last 7 candles closed below the Downtrend Angle!!
And now, the HUI begins to bounce upwards. The Downtrend Angle was and is bearing up. Thus, it is mutating now to be the DECADE SUPPORT ANGLE. A mightily important angle support has evolved!
Ok. The tension has relieved. A Decade Support Angle is supporting the HUI now. The bear market low was brought in with the January 2016 at 99.19 index points. There, at the January 2016 low a new initial impulse starts.
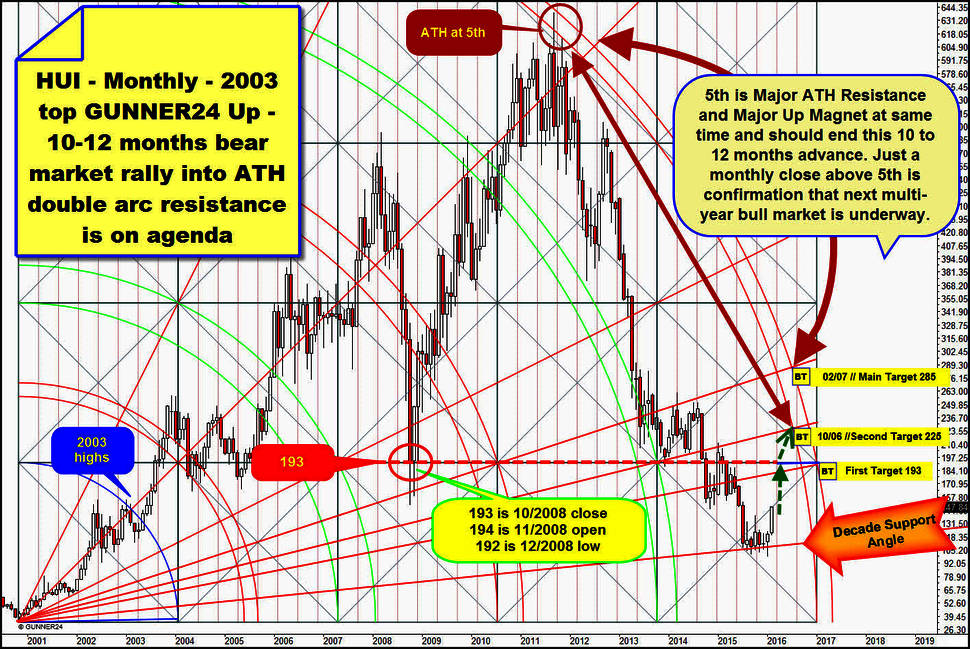
Let’s evaluate now the uptargets of this new bull market according to price and time. For this, we are going into the monthly time frame again, newly starting at the 2000 bear low and logically connecting the bull market run of the years 2000-2011 with the starting point of the setup pursuing the normally most natural end target of an uptrend that again is the 5th double arc:
It’s got to be important for us to comprehend what this newly started bull market intends to do, which are the milestones it wants to attain and it will perhaps even have to work off.
This up setup is clearly pointing to the 193 to be the first target the new HUI bull will reach. The next higher very important resistance area put out by the setup is situated there. This next higher resistance magnet is the first square line with absolutely confirmed importance for the market because it is where in 2008, at the important 2008 bear low surroundings a monthly close (193), a monthly open (194) and a monthly low (192) were attained.
The 193-resistance horizontal is now exerting powerful magnetic effect to the price. Consulting the very most important low of the market during the last decades and the 2003 top GUNNER24 Up Setup above, actually there’s no important resistance left between the current index level (147) and the 193: Between 147 and 193, there’s only empty air!
==> In the first analysis, this leads you and me to the obligation to start to buy immediately on Monday. The 193 first target is a no-brainer. The one who buys in the course of next week cannot loose, no matter what a detour the market may make to the 193! So, start to buy at once!! If you cover your long positions then at 193, you won’t have gone wrong!
Ok, further on. The 2003 top GUNNER24 Up Setup is also a so called decade setup after all defining future decade supports and resistances and therewith future important decade magnets.
Since the ATH of the year 2011 was made at the 5th double arc, the 5th double arc is confirmed decade resistance and likely upwards magnet for this new bull market.
With more than an 80% of probability, the 5th major decade resistance will be headed for and reached in this new bull market.
Since the 5th above is the next most important decade resistance magnet for the future, the new bull market will technically come to an end topping out there. In succession, the HUI will be pressed down again by the 5th resistance probably being forced to follow it downwards till the middle/end of 2017 to develop there and then another low at the 50 surroundings!
Conclusion: Everything to come now will come to a natural end at the 5th double arc decade resistance! We’ll have a relatively short pleasure, but anyway: Gold and Silver Miners boom cycles may be very profitable if you bet on the right assets.
The likely second and main target of this bull run are correspondingly at the lower line of the 5th resp. upper line of the 5th double arc decade resistance!
If the 193 succeeds to be cracked on monthly closing base, the HUI should have to be able to reach at least the 225 in a run lasting 10 months. There and then, an important angle intersects the lower line of the 5th. This angle was responsible main support for almost the entire year of 2014 thereby being a next higher backtest magnet for the HUI.
==> Second target is 225 being timed to be worked off for the month of October 2016, at the latest.
The maximally permitted extension of the new bull market – as things stand today – is the 285 till exactly in 1 year. There and then, another important angle intersects the upper line of the 5th. This angle delivers support at the final bear market low of the year 2008 thus being a next higher backtest magnet for the HUI.
==> Main target is 285 being timed to be worked off for the month of February 2017, at the latest.
Let’s switch now to the bear low of the year 2008 and the present effects that this important bear low still exerts to the HUI. It determines the rather shortterm development of the market:
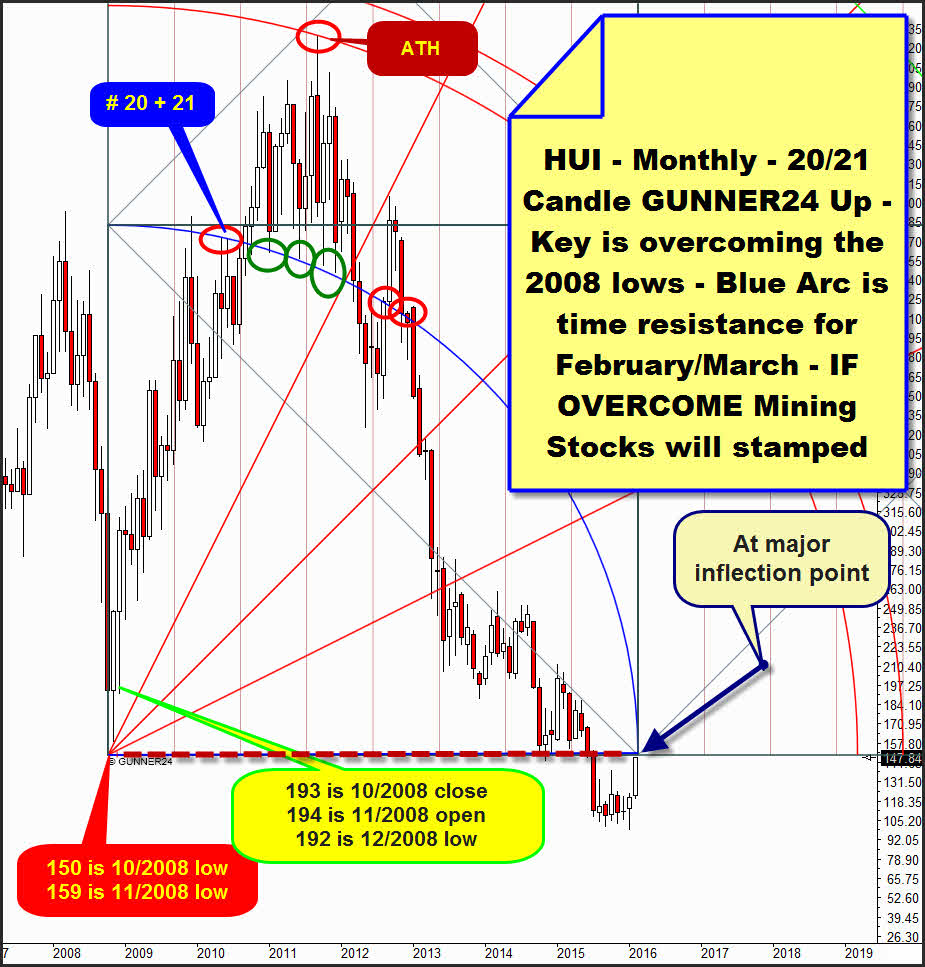
Mainly, I’m going now into these shortterm expectations. How perfectly this 20/21 Candle up setup from the 2008 low caught the past at important monthly tops and lows, you may look at yourself at the red and green ovals I inserted.
The most important realization from this setup is that the test of the 2008 bear market low surroundings is likely due as early as in the course of next week. The HUI is supposed to rise into the region 150-159 next week. At 150, the final 2008 bear low powerful horizontal resistance on yearly base begins going up to the low of the month 11/2008 = 159.
Technically, yeah technically, the HUI should soon have to form an extremely important high between 150 and 159. Well, since 150-159 is matter of a powerful former bear market low resistance, the reaction to this resistance should have to turn out hefty. I mean, the HUI should have to rebound from the 150-159 harshly and quickly, above all falling very deep again! Technically!
Please consider more closely the state of the Blue Arc in the chart above. It used to be an extremely important attraction in the past. Last, it delivered strong resistance at the last red oval. There, a hefty several month sell-off started at it!
This Blue Arc intersects the time axis to the next month, March 2016. It seems to me compelling that the HUI has and wants to touch this Blue Arc now, in February or/and in March. The Blue Arc is certainly the main attraction for the price at the moment. A backtest of the Blue Arc seems to be compellingly necessary!
The signal situation by virtue of the existence of the 150-159 horizontal resistance area and the confirmed Blue Arc resistance is for sure – ATTENTION, BOTH ARE CONFIRMED RESISTANCES ON YEARLY BASE:
==> If the HUI clears to close above the 159 in February and/or March thus overcoming the Blue Arc, there’ll be a truly monstrous buy signal!!
==> In 2nd consequence, that leads you and me compellingly to buy either a February or a March 2016 close above 159!... because, as mentioned above, "The 193 first target is a no-brainer!!!" The one who buys a February resp. March close above 159 cannot loose, no matter what kind of a detour the market makes until the 193! Those who cover their long-positions then at 193 won’t have gone wrong!
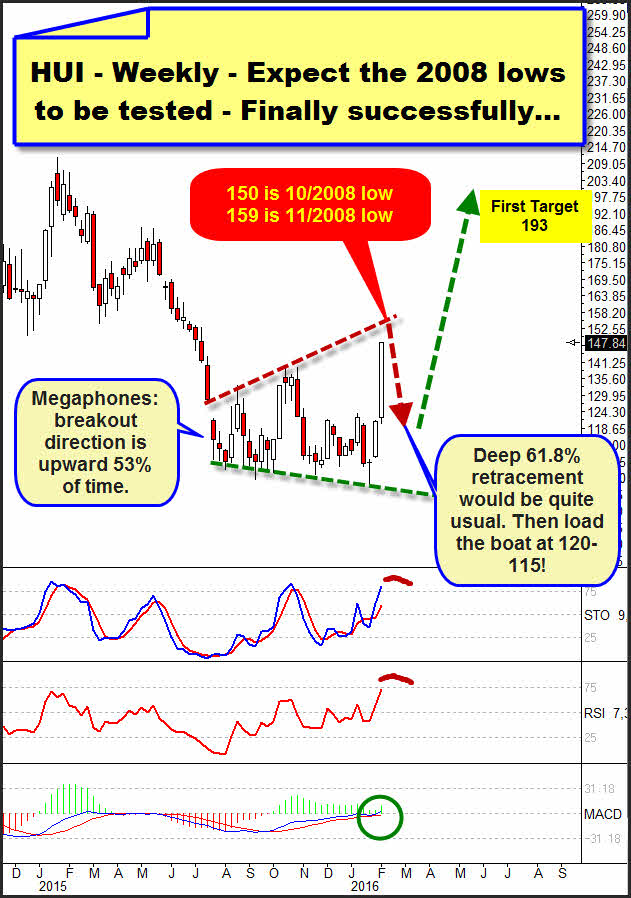
Technically, yeah technically, the important and thus strong resistance in the yearly time frame at 150-159 in the now pending test seems to me unsurmountable. The chart above is signaling so. So does the weekly situation:
I see that a megaphone pattern = broadening bottom has developed resp. formed at the bottom. Pre-condition for such a pattern is that at least two peaks and two valleys should touch the associated trend line.
Since the Slow Stochastics RSI have some room for upwards improvement before reaching overbought territory, the third peak at the megaphone resistance line should have to be feasible to be brought in within the next week, at the latest the week after next =150-159! Technically, the currently most important yearly resistance magnet is thereby supposed to be reached in the current weekly upleg! Sic.
As to statistics, broadening bottoms dissolve upwards ultimately with a 53% of probability. The ultimate dissolution of the megaphone in the final analysis is currently signaled by the MACD oscillator. It is just at the beginning of its ascent having – in theoretic terms – an enormous lot of space upwards = time. before reaching the overbought area! This should have to last some months yet!! So, MACD is signaling that the 150-159 resistance should be ultimately overcome sometime.
Megaphone patterns are malicious and tricky to be traded, especially when they appear at a potential bear market bottom. In the megaphone, the price is often subject to surprising swings, turns as well as fast and hard moves, thereby after the third test of the megaphone resistance at 150-159, a hefty new down move may be imminent. This one may – after the rulebook it can – even reach once more the multiply confirmed megaphone support line!
==> In this case, such thing is technically impossible… since we know with nearly a 100% of certainty – see detailed analysis above – that a decade resistance was skipped having started a new bull market with target 193 by the 100 having been worked off.
==> Thereby, in this case that means that each hard bounce from the megaphone resistance line and from the yearly 150-159 resistance magnet would be a true gift of God. A deep 61.8% retracement starting from the actually powerful 150-159 resistance on yearly base seems to be really impossible at present, the possible existing megaphone pattern would thoroughly permit such a deep retracement however. The bulls would absolutely be shocked if the HUI and the Mining Stocks came back once more the next couple of weeks.
==> Go ahead and buy like crazy Gold and Silver Miners if the HUI happens to test back again the 120 till the end of February/beginning of March!!!! Add to longs at 110!
In these whipsaw markets of the last weeks that might confuse any trader thus leading mercilessly to burning the trading account the professional signals have got their special importance. You get them in the GUNNER24 Gold Trader!
You best register with our GUNNER24 Gold Trader now. That’s where we oversee the optimal entries and exits for you. Especially in the difficult market situations where many factors have to be considered the Gold Trader is backed by the additional GUNNER24 Signals based on the combined 1, 4 and 8 hour setups to catch the optimum entries and exits.
The GUNNER24 Gold Trader will provide you with the critical knowledge you need to forecast and analyse the precious metals with the GUNNER24 Forecasting Method. All the GUNNER24 Trading Signals you receive real-time are based on the actual Gold and Silver Future. The NEW GUNNER24 Gold Trader is a must for every actively working investor and trader who wants to trade successfully in everyday trading. The insights you receive from the head trader Eduard Altmann (and discoverer of the GUNNER24 Forecasting Method) are truly amazing sometimes. I promise!
Click the button below and order the GUNNER24 Gold Trader - $39.90 US a month. For 201 members and up - $49.90 US a month.
Be prepared!
Eduard Altmann

