With the closing price of last trading week, gold newly sneaked up to the 1222-yearly GUNNER24 Horizontal Resistance. For as many as 4 weeks, inter alia this horizontal has been braking the precious metal. So far, the shining metal is simply unable to overcome sustainably this important pivot, but it hasn’t either bounced toughly off this important horizontal resistance in the yearly time frame bearing instead the reached high environment of the uptrend beginning at the higher 1-year-cycle low.
==> In the weekly graph, gold forms a consolidation bearing narrowly below the attained highs of this uptrend. Such consolidation formations are to be classified as bullish. They use to dissolve upwards with a probability of 65% approximately.
The weekly uptrend count starts at # 1, the final December 2016 low (15.12//1124.30$). Last week was the 8th!!!, the coming trading week will be the 9th of the current uptrend.
That December 2016 low - and we should be 100% certain about that now - is the FINAL!!! higher 1-year-cycle low that was caused by strong Gann Angle support in the DECADE time frame. The Dec15 actual bear market low as well as the December16 higher 1-year-cycle low found angle support in the DECADE time frame!
The # 8 closed at 1221.60, the week high was reached at 1227.50. Certainly it’s not mere coincidence that the 1222 trail wasn’t overcome on weekly closing base but cold closed scarcely below. So, gold couldn`t trigger a weekly buy signal respecting the 1222-being overcome. However, anyway it seems to get prepared to take the 1222 finally upwards next week!
Attention new traders: the importance of the xx22 resp. xx72 magnets for gold in 50$ intervals continues. This condition is going to remain important for many more years. Newbies may read up here what it’s all about with the 50$ resp. 25$ steps gold has been respecting since the year 2012 in a downright maniac way.
Although recent week # 8 was able to deliver the highest high and the highest weekly close of the running uptrend cycle, it’s just the uptrend count that causes concern for all the gold-bulls.
Simply the fact that it was the 8th week of the trend that made the first serious try to break upwards through the 1222 - not being crowned with success undoubtedly – permits the uptrend to have exhausted with the high of the recent week for the time being. Being Fib number, the 8 is always a potential turning magnet! ==> This count combined with the first failed try to overcome the 1222 allows the beginning of a pullback that might not only test back the 1172 that’s newly horizontal support in the monthly time frame but even make reach the 1150!
However, there are also many bullish factors that allow the magic 1222 to be overcome rapidly and swiftly in the course of the coming 5 to 8 trading days. If this succeeds, the trend will HAVE TO last for 12, probably 13 week candles, and in that case it will HAVE TO reach/work off compellingly the 1272-yearly GUNNER24 Horizontal being the next higher main threshold above the 1222.
==> In my opinion, the 1222-yearly GUNNER24 Horizontal Resistance to be overcome soon and decisively within 5 to 8 trading days is preferable because:
A) in the weekly time frame a bullish consolidation scarcely below the 1222 has formed.
B) The weekly upwards momentum keeps on in the stable uptrend having some room for improvement before reaching critical overbought conditions.
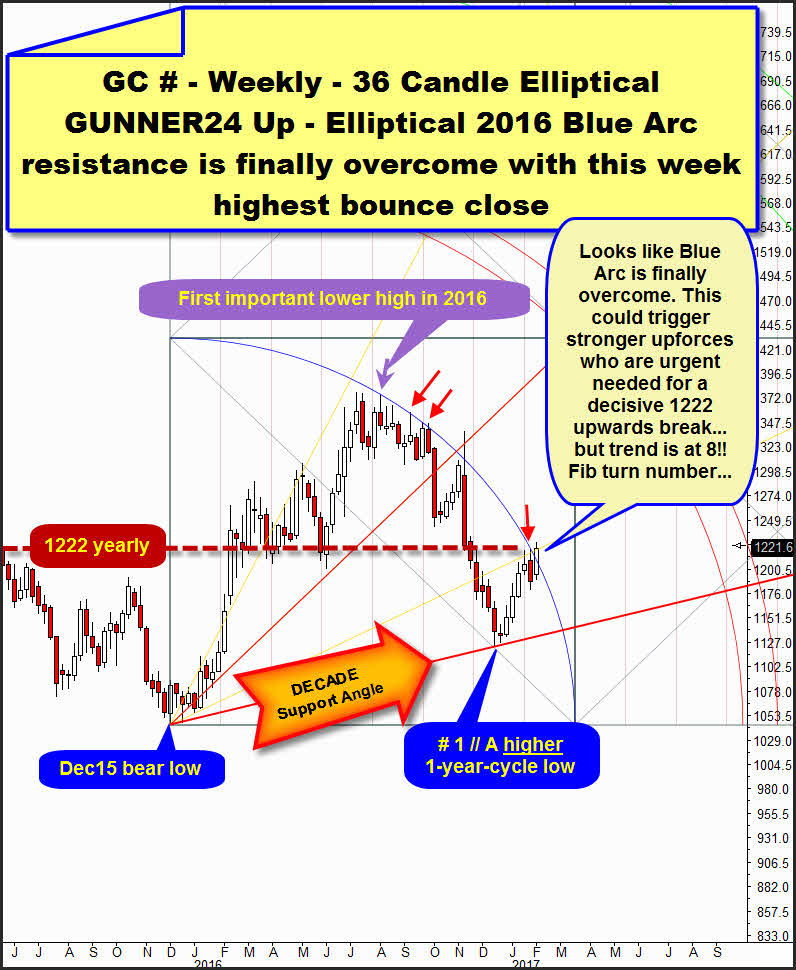
C) Thereby, I’m coming to the weekly chart above and both currently most important GUNNER24 Up Setups. With the positive high close of # 8, gold succeeded – with no doubt – in overcoming finally ALL the nearest GUNNER24 Arc Resistances that exist for the year 2017!
==> Being overcome all these natural main arc resistances in the yearly time frame really has to release some new upforces that therewith should have to lead to the 1222 threshold to be overcome quickly and finally!
Above, you see a valid GUNNER24 Up Setup for gold. Starting point of this elliptical setup is the absolute bear market low reached in December 2015. The elliptical Blue Arc has its first anchoring point at the first important lower high of the year 2016. This high, depicted with the purple arrow was the first important lower week high AFTER the final 2016 high… this first important lower 2016 high triggered thus "officially" a downtrend in the weekly time frame gold is still in.
The week of the first important lower 2016 high was the 35th week after the attained Dec15 bear market low. Therefore, it is in striking distance of the 34 Fib number regarding the Fib count, and thus this high means a natural important turning point in 2016.
Tracing the Blue Arc into some other important lower weekly downtrend highs highlighted with the red arrows, we realize that the thereby automatically resulting Blue Arc is - to be more precise - WAS multi-confirmed elliptical arc resistance in the weekly + yearly time frames.
It was multiply confirmed weekly high as well as weekly closing base resistance. It was another strong resistance for 2017 that is now finally overcome with past week # 8-close!
Past week positives usually is bullish in the short term! The # 8-1221.60$ close has delivered a weekly GUNNER24 Buy Signal, so more upwards for gold should be expected!
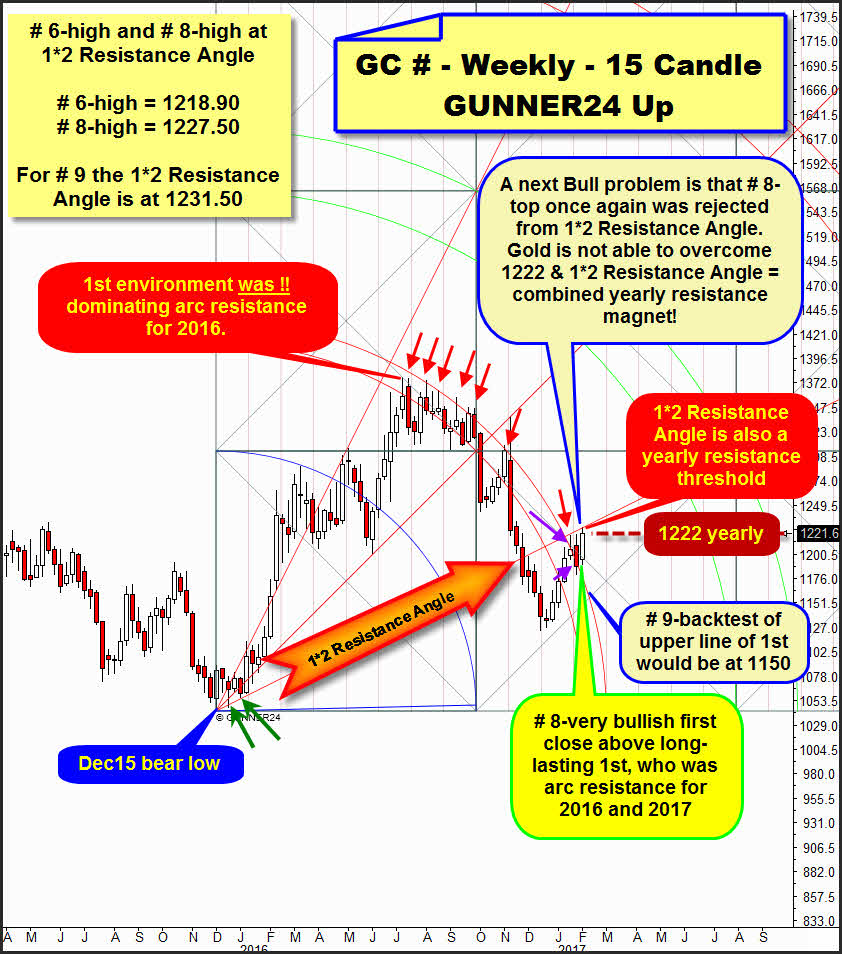
==> In the following chart, I’d newly like to deal intensely with a good old friend of ours: The circular 15 Weekly up starting at the Dec15 bear market low.
Last, I took on this important up setup:
Click: Free GUNNER24 Forecasts, issue 01/15/2017 "Gold at the crossroads - once again!"
The 1st main resistance double arc represents yearly resistance magnet for 2016 and 2017.
==> For the first time ever, gold was allowed to close above the 1st!!! ==> Thus, also this "very most important" weekly gold up setup triggered a weekly GUNNER24 Buy Signal!
Uptrend week # 8 closed far above the upper line of 1st resistance, after the uptrend weeks # 6 and # 7 still showed unequivocal fighting clues, caused by the upper line of the 1st. # 6 had yet to close scarcely below the upper line of the 1st. # 7 opened far above the upper line of the 1st already, but with its closing auction it was forced once more below the upper line of the 1st – see purple arrows.
Being overcome the 1st, such a long-lasting and dominating resistance is actually a BIG THING.
Usually gold should be able to break through the 1222 cause a buy signal is what it is: It promises more upside in general!!! It means strong existing buying power!!! The 1222 major threshold could be taken out soon and hard!
But there’s still another problem for all the bulls. Please mind now the comportment of gold at the important 1*2 Resistance Angle! The 1*2 Resistance Angle is always an important Gann Angle for any market. To the gold bull’s sorrow, this one is currently also a resistance in the yearly time frame.
The 1*2 Angle stems from the lowest bear market price. It springs from the 2015 bear market low. Thereby, the angle is automatically important for the years 2016 and 2017 etc.
The 1*2 Angle support was pulverized after Trump’s election, and it was tested back NEGATIVELY at the # 6 and # 8-highs! Thus, the yearly 1*2 Resistance Angle has so far likewise impeded a strong rally-like move, for quite some time having braked the metal additionally.
==> In 2017, the precious metal is restrained by the slightly upwards sloping 1*2 Resistance Angle as well as the 1222-yearly horizontal resistance. Together these two important yearly trails form a natural yearly GUNNER24 Resistance Magnet that will obviously be hard to be cracked. Just because of this existing yearly resistance magnet, gold has been grinding upwards pretty slowly during the last couple of weeks.
Be prepared!
Eduard Altmann


