What a fight for the upwards trend
Whereas in the course of the week the Dow Jones and the S&P 500 suffered relatively moderate losses the NASDAQ-100 is exhausting its permissible downwards potential to the limit. As mentioned several times in the last week analysis, the NASDAQ-100 is "allowed" to fall to the Primary Gann Angle anchored in the GUNNER24 Up Setup without endangering the rally.
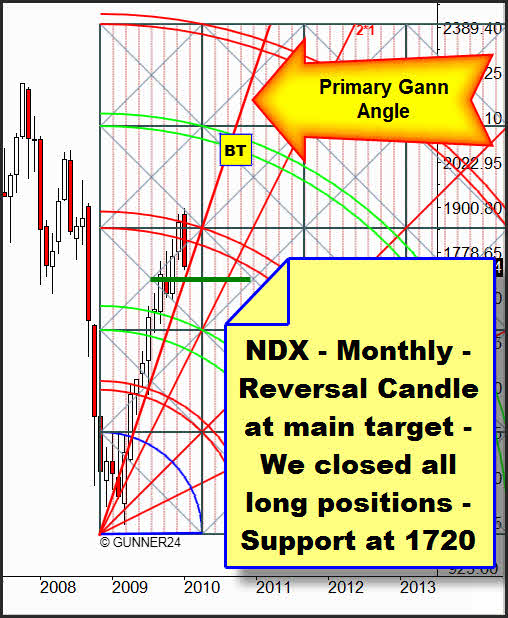
Among other things, within the systematics of the GUNNER24 Forecasting Method some back tests like that have to take place in order to stabilize and define the supports and resistances. At the same time, all the lines, arcs and angles in the GUNNER24 are magnets which attract the price or make it rebound respectively but at the same time, they may boost the trend.
The situation: On that Thursday the day after the FOMC statement we advised our members to cover all the long positions on monthly basis in the American stock markets in case the support diagonal in the NASDAQ-100 was broken at 1792. Further reasons are the monthly reversal candles expected everywhere and the effective threat the February candle might be skipped over, more or less in terms of time just because the February candle opens precisely on the primary Gann Angle. The Gann Angle may become the price resistance simply because of being "skipped over". Actually that means: The support of 1/29 may be the resistance of 2/01. But please pay attention to the important support line at 1720 marked in the GUNNER24 Setup. It represents the first possible support in the Monthly GUNNER24 Setup. So, combining the other signals we will get a suitable plan on how and when the upwards trend may continue or how far the correction is expected to go, respectively.
The second short signal in the Daily GUNNER24 Down Setup shows that for the NASDAQ it is going to be extremely hard to resume the upwards trend next week.
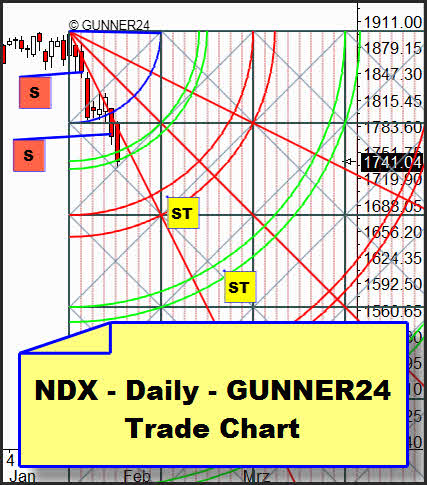
In the Daily GUNNER24 Trade Chart, the second sell signal on Thursday was particularly strong (simultaneous break of the blue arc and the first square). Both sell targets were activated by the Friday close within the first double arc. If the upwards trend wants to be resumed – that should happen next Monday (at 1741) or the Monday after next (at 1720).
In this connection, pay attention to the actual GUNNER24 Up Setup, as well:
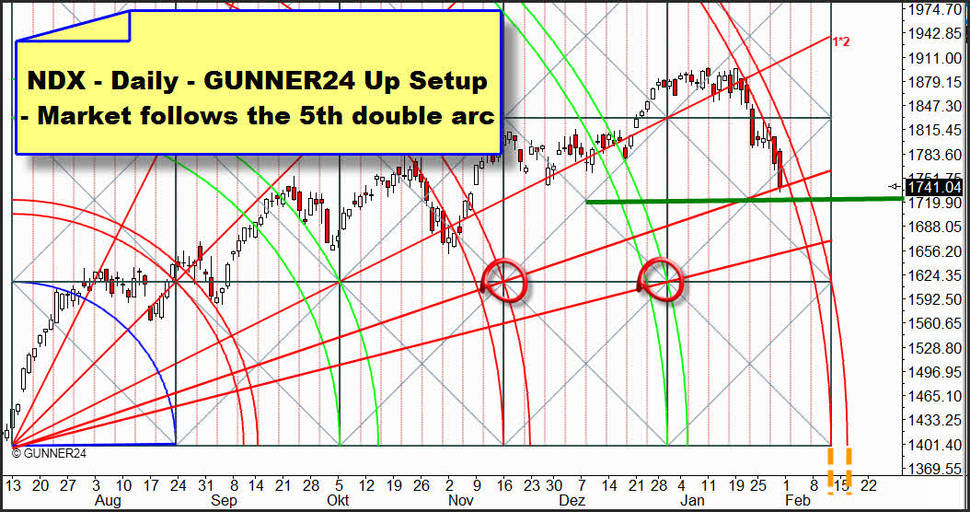
Here, the upper setup-anchored Gann Angle offers support. If it increases the trend the support breaking the 1720 (green support line) on daily basis we will see prices up to 1670 at least.
The figure of 1720 in the NASDAQ corresponds more or less with the weekly support which is to be expected at the YM # contract.
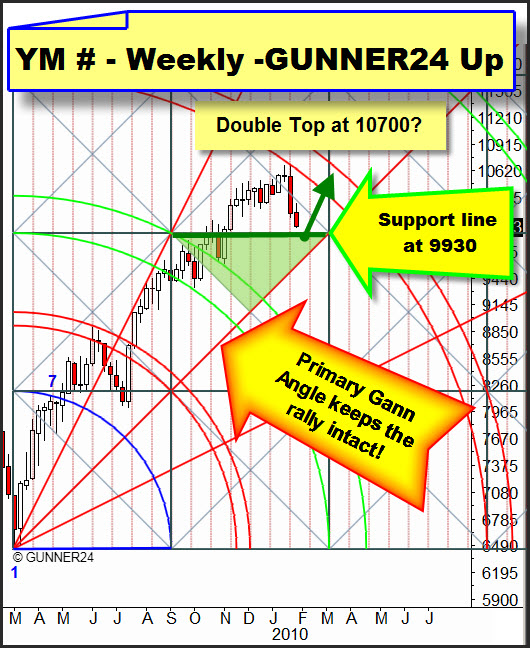
Still, the market is in the bullish part of the setup, underneath there is the dynamic support zone (green triangle) that begins at 9930. But we are approaching the narrow end of the triangle where the support space can be pierced "easier and easier". The long entry on weekly basis may be risked subject to the resistance of the support line and to the support zone which begins with the line. But we will have to wait and see the next week for that.
To close the stock market analysis let's have a look at the actually valid S&P 500 Monthly GUNNER24 Up Setup:
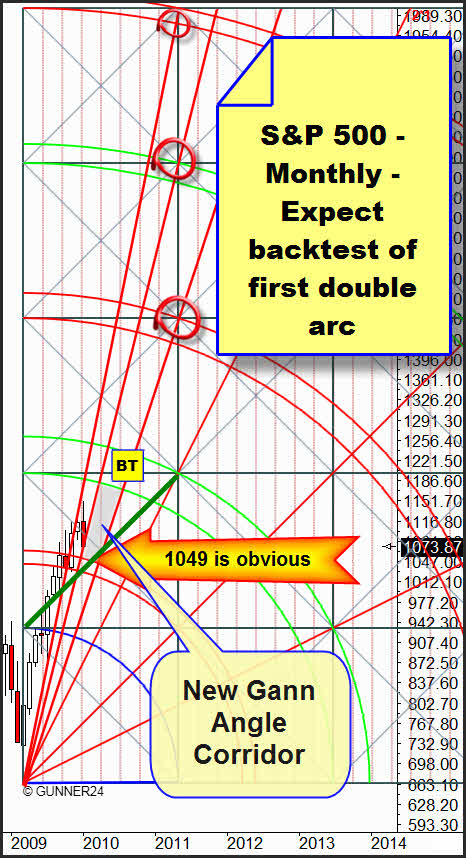
The February candle is going to open undoubtedly in the new Gann Angle corridor marked light gray in the setup. The Gann Angle that so far has offered support is converting into resistance. Here, at 1049 we should expect a back test of the well recognizable price and time magnet. The upper line of the first double arc is exactly at the point where the green support diagonal marked in the chart is crossing at about 1049 (with extension to 1032).
In gold, the monthly support (GUNNER24 Forecasts, Issue 12/06/2009) and the weekly support that is simultaneously existing in the Weekly GUNNER24 Up Setup keep on resisting at 1075.
Being the objective of the down swing, the retest of the 1*1 Gann Angle did not take place last week, but it is going to happen next week. Furthermore, the coincidence of the price and the 1*1 Gann Angle at the important time line of the recently passed square is offering the ideal precondition for resuming the rally to the main target at 1075 with a double bottom.
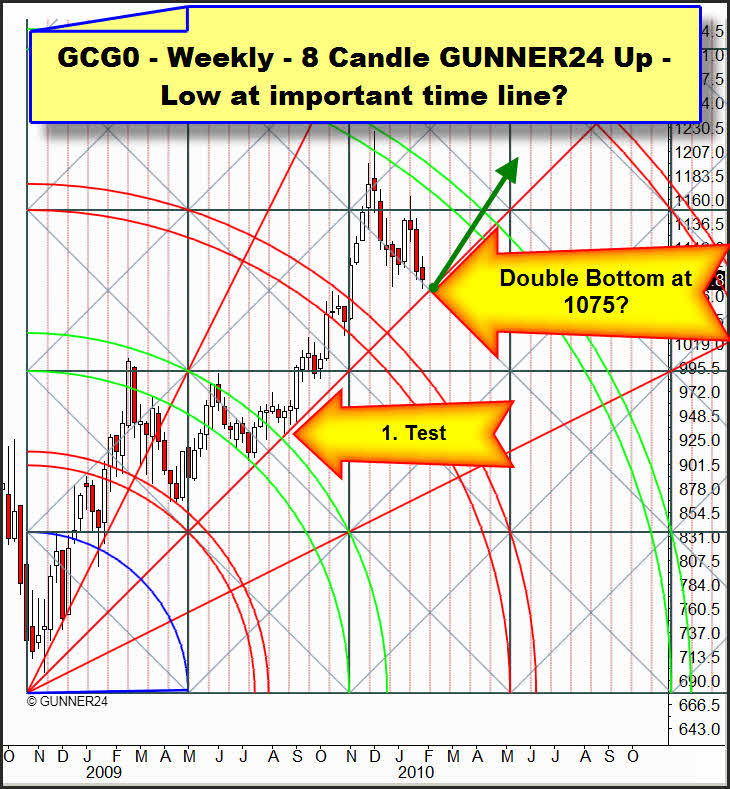
One thing is for sure: If the Gann Angle is broken on weekly basis an extremely bearish situation will emerge because the gold price would be in the bearish part of the setup and we would level all the long positions changing to the short side quickly. Since next week we are expecting only the second test of the 1*1 Gann Angle, actually that break is not due yet.
Silver has not respected the support diagonal at 16.65 (http://www.gunner24.com/newsletter-archive/january-2010/24012010/). Last week, at the upper line of the 4th double arc it found its support.
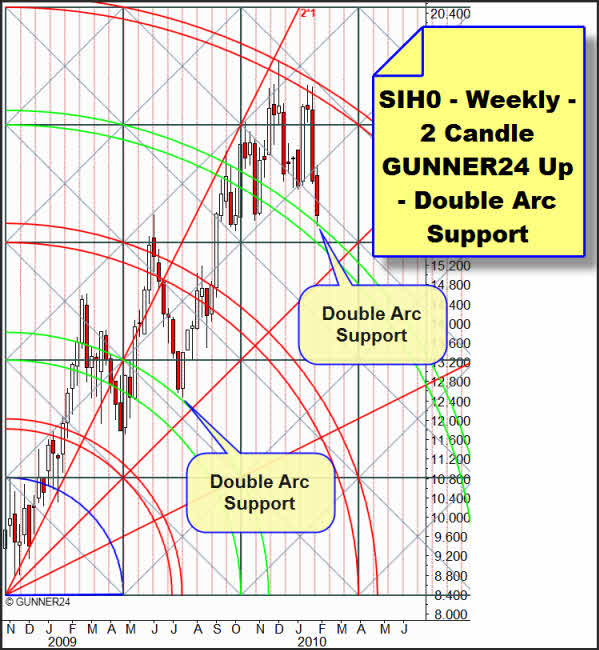
Maybe the performance of June/July 2009 is going to repeat when the price rebounded energetically at the 2nd green double arc to resume the rally. In the GUNNER24 Forecasting Method, those back tests of the green double arcs are frequently to be seen. They are neither critical nor seldom, but rather to be expected within the strong trends in order to confirm the previously broken green double arcs as to be supports just like in June/July 2009. The situation never becomes critical before the price is diving into the green double arcs from above (a serious warning signal for reassessing your tactics!) or closing in it respectively (confirmation that something is going completely wrong). Just like last week, on daily basis we seek for the long entry at 16.65. Like always, please do not carry out the entry before a reversal candle has emerged.
Be prepared!
Eduard Altmann
