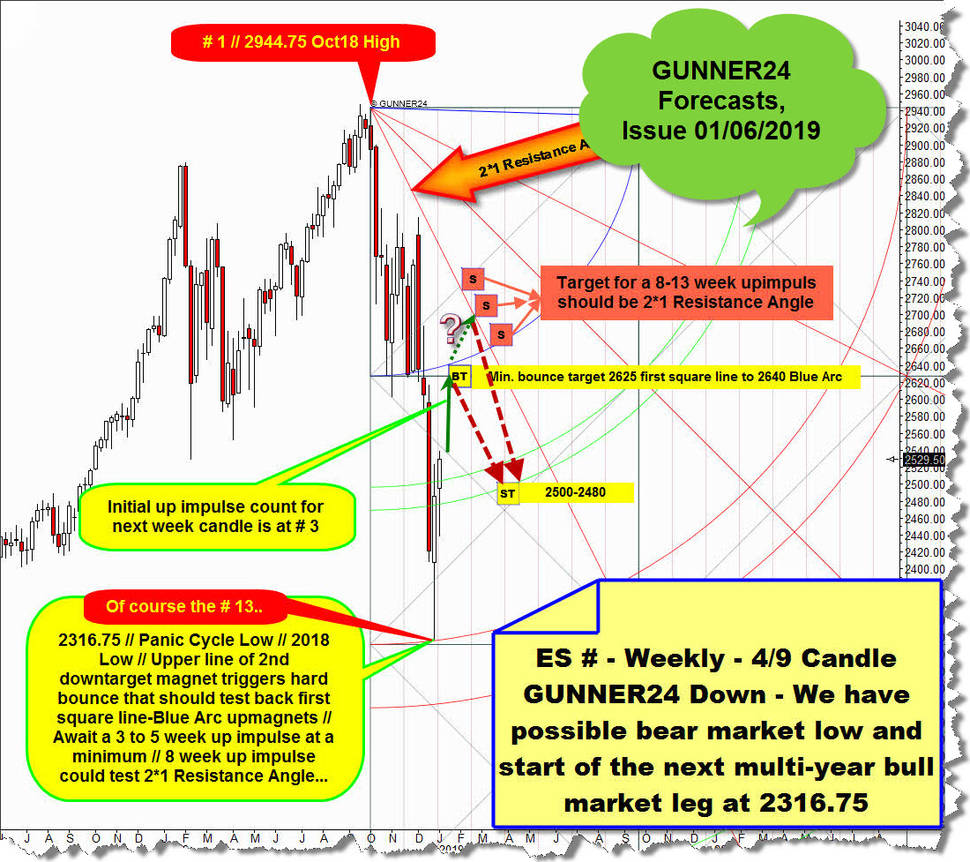
The last time I analyzed the US stock markets with the help of the e-mini S&P 500 continuous future contract (ES #) was in the January 6 issue - "Now the Stock Market Bears will be grilled" - when I presented:
1. That the achieved December 26, 2018 lows likely mark the end of the last bear market and will be the start of the next longlasting new bull market.
And, most importantly, to sustainably benefit from the latest findings:
2. Why the US stock markets are supposed to be running smoothly upwards for a total of 5 to 8 week candles and the ES # should at least reach a 2625 pts minimum GUNNER24 Upmagnet within the newly started upcycle:
Then the 2625 pts WAS a combined weekly and monthly resistance upmagnet, very attractive near-term price target and somehow obvious for the rally out of year 2018 Panic Cycle Low.
Overcoming that 2600-2625 on monthly/weekly closing base was most diffcult thing for the perhaps now resumed bull market and overcoming the 2640 pts initial Blue Arc upmagnet resistance within above anchored weekly 4/9 Candle GUNNER24 Down, starting at October 2018 High should release an at least 8 to 13 weeks lasting rally leg which must inevitably work off the 2*1 Resistance Angle out of October 2018 High.
And that's the way it will be ... even though this week closed well above the Blue Arc rally-continuation trigger:
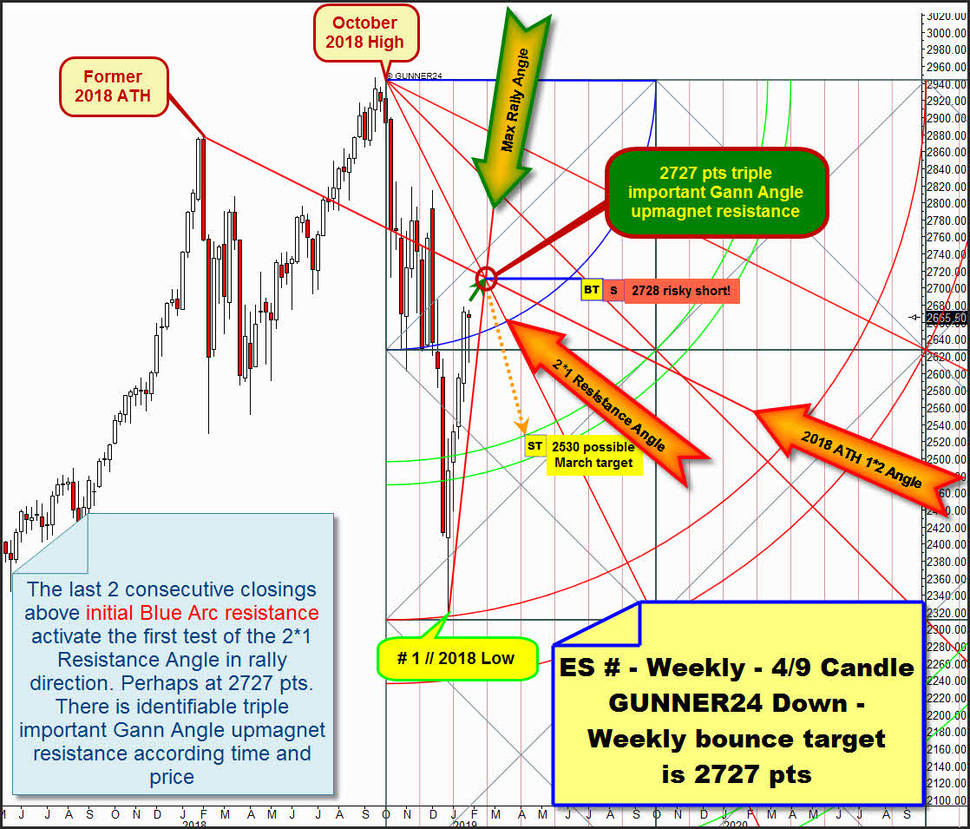
ES # for the week closed at 2665.50 pts and this is the second consecutive week close above the Blue Arc, now nearest weekly support below. This is an impressive GUNNER24 Rally Continuation sign, thus it is a necessity that the 2*1 Resistance Angle in (rally-) trend direction must be tested.
==> It will have to come to further rally highs. Period. The current rally high is the high of rally week No. 4. It is at 2677.75 pts. From there the market should run 50 points higher again. With a 90% probability in the course of rally week # 7 or # 8 market is expected to test 2727. Because at 2727 to 2730 then is an IMPORTANT Gann Angle CLUSTER which should now attract the price magically.
Maybe these two rally weeks each have to reach and work off the 2727-2730 finally!... let`s see.
Within weekly chart above I have highlighted the all in all 3! important Gann Angles that form the Gann Angle CLUSTER in the WEEKLY. In the weekly chart the IMPORTANT Gann Angle CLUSTER is visible at 2727 visible. It is shaped:
A) By the already discussed 2*1 Resistance Angle, now activated next important natural rally target.
B) By the 1*2 Angle (... big 2019 BACKTEST resistance...) directly out of prior 2018 alltime-high (ATH). This 2018 ATH Resistance Angle should act as very important resistance angle on yearly base. Per se, the 2018 ATH Resistance Angle became normal backtest target for the rally after the rally closed above 2625-2640 on weekly base!
C) By the angle I named "Max. Rally Angle", the angle that derives directly from the # 1 // 2018 Low and that is most possible existing steepest Gann Angle support out of a low. Well, the Maximal "possible" Rally Angle".
==> Weekly triple important Gann Angle upmagnet resistance at 2727 pts. This 2727 pts Gann Angle resistance CLUSTER in the WEEKLY exists however only for the month of February 2019 and exactly for February 4 to 15!
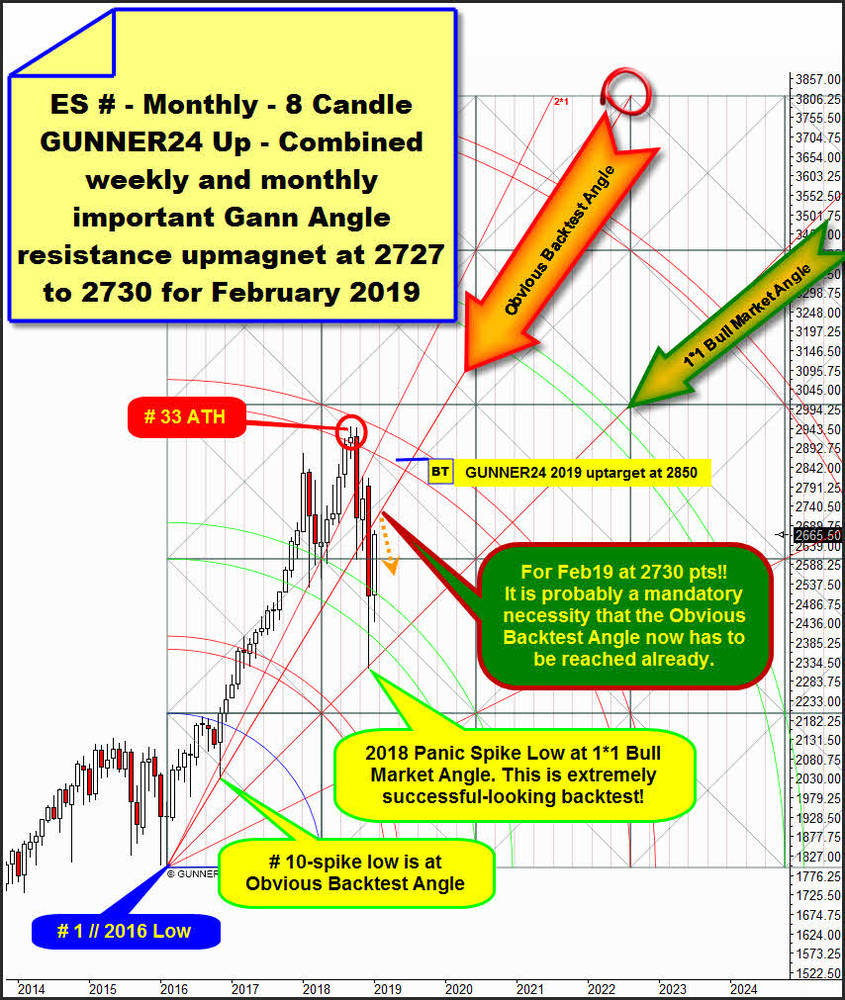
And as if drawn by magic hand, there is a very important Resistance Angle out of important 2016 Low in the monthly candlestick chart for the entire February 2019 Candle exactly at 2730.
==> Activated GUNNER24 Backtest Uptarget for this rally on monthly base at 2730 pts/February 2019:
Year 2018 Panic Spike Low is the perfect, pinpoint backtest of the strongest bull market support that began at # 1 // year 2016 Low. The most strongest imaginable support within a GUNNER24 Up Setup is always the 1*1 Gann Angle and 2018 Panic Spike Low has "just" tested back strongest existing bull market support and natural 50% Gann retracement support of entire 2016-2018 bull run.
Thats why there is now: a 65% chance that entire downtrend has ended ... at 2316.75 pts 2018 Panic Spike Low... and the next strong multi-month lasting bull market upwave has begun, which then usually will be able to print some higher alltime-highs in course of 2019 and 2020...
A clear monthly close above 2625 - maybe ES # at >2640 pts or so - officially triggers the often necessary backtest of the magnet that triggered prior important turn or top. And this is the 3rd double arc resistance upmagnet or alltime-high resistance double arc where the 2016-2018 bull market run topped at # 33 ATH after a to the Fib number 34 oriented month cycle.
Normally the very first monthly close above 2640 until end of March triggers the hard backtest of the lower line of 3rd double arc until April to May 2019 at around 2850 pts.
And well, GUNNER24 Method expects at minimum a 2850 pts backtest of the 3rd double arc main resistance upmagnet in further course of 2019 for the ES #!
Actually market trades nicely above the monthly 2640 pts rally continuation trigger, what indicates that bullish forces still have the upper hand and so it is very likely, or from my perspective inevitable, that after this huge bullish January additionally at least the first part of February 2019 will be backed by aoverall bullish forces.
==> It is to be expected that February candle will be able to print a higher high than January candle! And see where such higher month high could be printed...?!!
Likely at within above setup naturally anchorable angle, I`ve highlighted "Obvious Backtest Angle", that runs at 2730 pts for coming February 2019 candle.
"Obvious Backtest Angle" should act as really important backtest target resp. upmagnet for the rally cause this prior important bull market angle support kicked in at # 10-low, which was the Trump elect low and this former very important bull market support hit made at "Obvious Backtest Angle" has triggered for sure one of the strongest bull market waves ever in the US history!
==> It is now completely normal that the "Obvious Backtest Angle" will be tested back in trend = rally direction.
==> Next activated monthly uptarget is the test of Obvious Backtest Angle that is at 2730 pts for coming February 2019. This MAJOR important monthly backtest target adds to weekly triple important Gann Angle upmagnet resistance at 2727 pts.
==> We have identified important Gann Angle CLUSTER that is at 2727-2730 for February 4 to 15!
==> 2727-2730 important Gann Angle upmagnet resistance is usually so attractive that it will be worked off within current running weekly upcycle!
Furthermore – as to my assessment – just the final execution of the 2727-2730 pts important Gann Angle CLUSTER increases most dramatically the probability for the US markets to start a next severe weekly pullback or correction cycle, which then could lead to a 2540 support backtest for ES # in course of March.
However, if either in February or March 2019 a significant monthly close above the "Obvious Backtest Angle" succeeds = monthly close above 2740 or so, an upwards continuation up to the 2850 pts 3rd double arc main resistance upmagnet should be imminent!
Be prepared!
Eduard Altmann


