Again the equity markets closed extremely solid. There’s no sign of exhaustion and no sign of an upcoming profound correction. With this newly positive performance of last week the main targets of this upswing are already – sooner than expected – getting into their impact distance – at least in case of the S&P 500 and the Dow Jones. That’s where we’ll cover our long run long-engagements on weekly and monthly basis.
Before we start to deal with these weekly and monthly cover areas in detail, let’s have a brief look at last week:
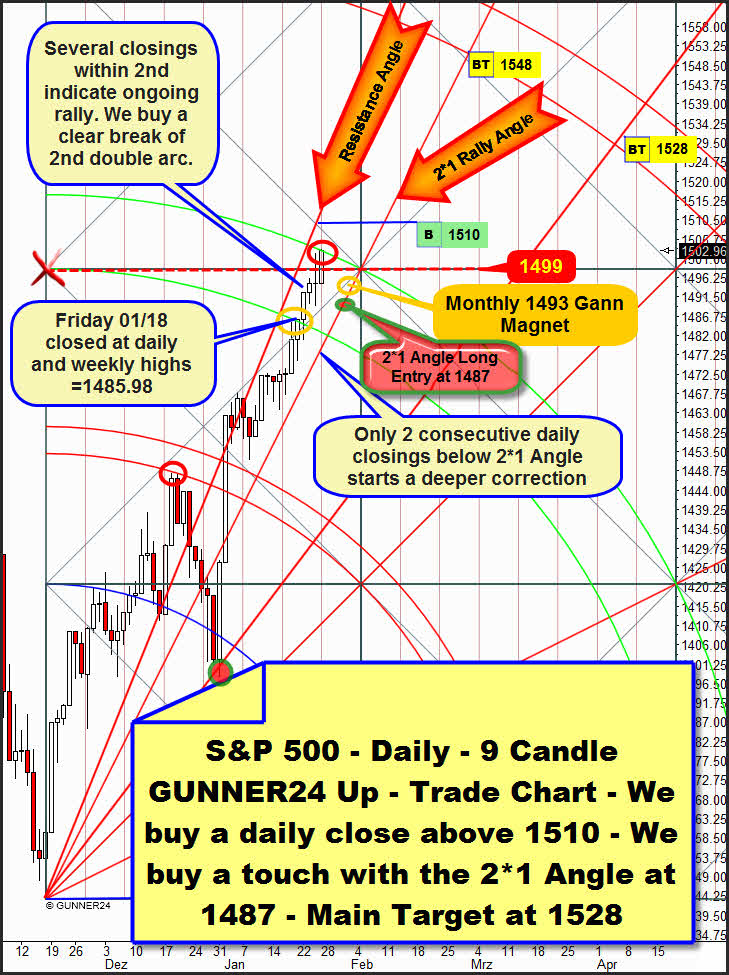
In the 9 Candle S&P 500 GUNNER24 Up we can clearly make out how strong last week performed and why the main target in the S&P 500 may be reached next week already.
The last 4 trading days newly show extraordinary power. On Friday 01/08 the index closed the week exactly at the lower line of the 2nd double arc at 1485.98. In a setup, technically each lower line of a double arc is the beginning of a resistance area that stretches from the lower to the upper line of the double arc. The last 4 days pushed from the lower line of the 2nd exactly to the upper line of the 2nd however. It’s a sign of brutal power if the space between the lines of a double arc is traversed without any correction. Last trading week newly closed at the weekly highs and newly at an important Gann magnet that may force the market into a correction again on Monday.
But if the market doesn’t do so, I mean if it doesn’t turn down at the beginning of the week – this is the assumption we’ll have to work on because a week close at the highs leads inevitably to a strong weekly start – closing clearly above the 2nd double arc on daily basis, the 3rd double arc will be activated as the next up target. So: If Monday and/or Tuesday close(s) above the 2nd, the 3rd double arc in the trend direction will be reached with a 70% of probability.
The main target of this swing is the 1528. As a matter of fact, this mark will be reached – in the current iii of the V or at the latest in the V of the V, later on in April 2013.
A clear daily close above the 2nd within the next five trading days will trigger the starting signal for reaching the 1528 in the current iii of the V.
With a daily close above 1510, the 1528 will be supposed to be activated on daily basis as well. That’s why we’ll buy such a close with main target 1528!
But just in case the thoroughly existing resistance function upper line of the 2nd does force the S&P 500 combined with the existing monthly Gann magnet at 1493 (derivation of this magnet – normally a strong monthly resistance - http://www.gunner24.com/newsletter-archive/january-2013/13012013) into a mini-correction or consolidation respectively in the course of next week, we’ll buy the index at the first touch with the 2*1 Rally Gann Angle. That might happen on Wednesday or Thursday at about 1487 points.
For pursuing/entering this possible trade I’d like to refer you to our trading performance site:
www.gunner24.com/trading-performance-us-stock-markets/
The 2*1 Rally Angle keeps being the trigger for a possible short entry. It will take two consecutive daily closings below the 2*1 to be able to force the market into a deeper correction. But obviously the market keeps following the steep trend corridor that is well defined, being limited above by the resistance angle and supported below by the 2*1 Rally Gann Angle. If this one resists, an extension/exhaustion at 1550 won’t be out of question.
But we’ll cover any long-position at 1528 MIT!
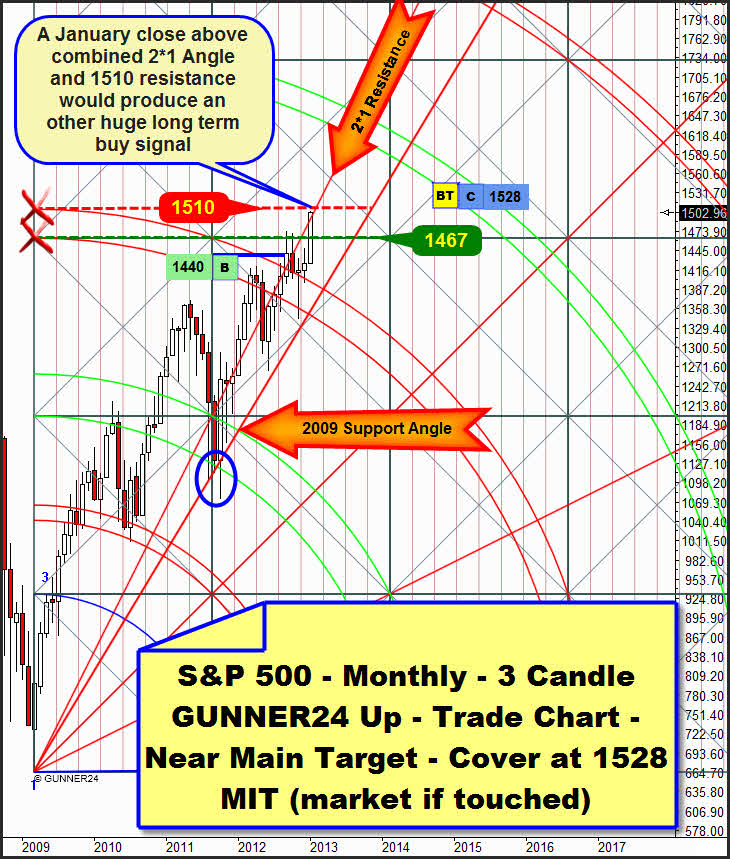
In the monthly time frame we went long at the end of September 2012 with first target 1528. (http://www.gunner24.com/newsletter-archive/september-2012/30092012/). At that moment the first significant close above the 3rd double arc in the monthly 3 Candle GUNNER24 Up Setup succeeded. Monthly main target for the whole upswing is the 4th double arc at about 1600. The 1528 are a main target in the weekly time frame, you know. After reaching this weekly target I expect a deeper correction that is supposed to lead to the horizontal GUNNER24 Square Line Support – very, very strong now – at 1467 points. According to the rules no monthly close below 1467 should be possible before the 4th double arc at 1600 will have been headed for.
Can you see the horizontal resistance above that arises from the intersection point of the upper line of the 3rd with the beginning of the setup – the 1510? That’s why a long-entry in the daily time frame won’t be possible before this monthly horizontal resistance will have been taken…
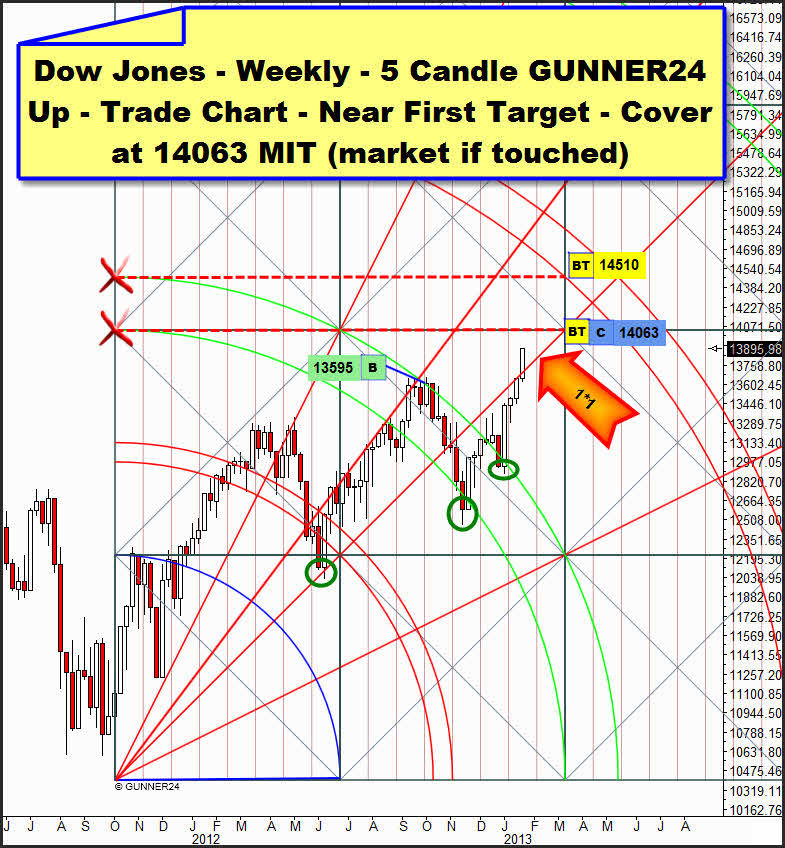
In the Dow Jones, we’ll cover our weekly longs we entered into on 10/05/2012 at 14063 MIT:
The actually strongest resistance in the weekly up setup is passing there. I’m pretty sure that this resistance is going to be headed for very soon now. The re-conquest of the 1*1 on weekly closing base is not only a visible expression of the trend power, but being reconquered such an important angle made the uptrend accelerate again at 13705… The up-energy that thus arose cannot be exhausted yet! The 1*1 will pass at 13755 next week. There, in those surroundings, no doubt you may buy a mini correction/consolidation at the highs.
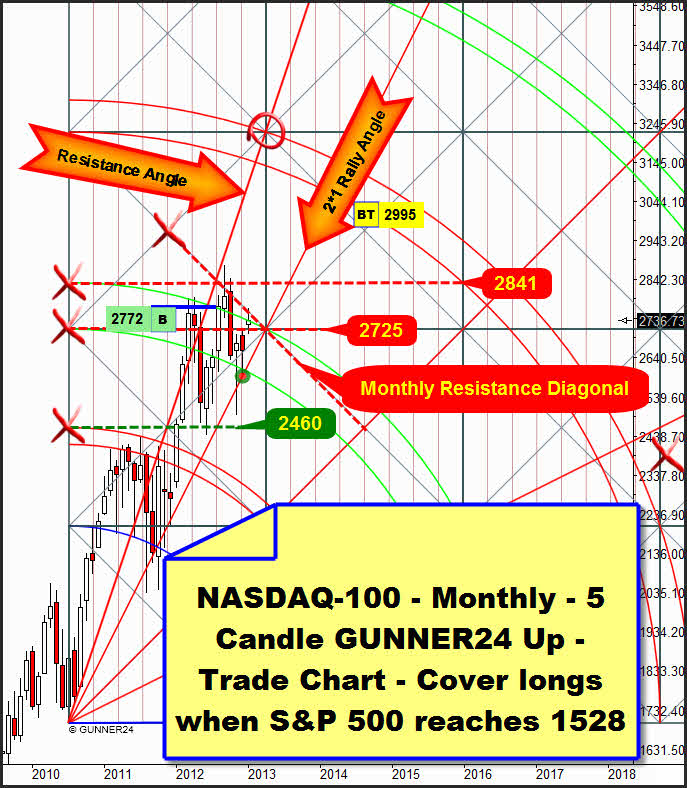
In the NASDAQ-100 we’ll cover the longs we bought by the end of August at 2772 when the S&P 500 reaches the 1528. So, possibly we will with a little loss…
All in all, for almost one year the index has been oscillating between 2450 and 2850. Compared with the Dow or the S&P 500 there’s few action. All things considered historically, it’s a pretty narrow margin that is going to be resolved upwards. Above it is limited by the horizontal resistance that starts from the upper line of the 2nd, and below it is defined by the horizontal support starting from the upper line of the first double arc.
Even though the entry was within the rules at the first monthly close above a double arc, the index is not really making any headway because of the current AAPL weakness. I think the index is still going to need some months before a final break out upwards succeeds. Thus there is a high probability that much lower we will get into monthly long-positions more advantageously. In any case the main target of almost 3000 points is supposed to be reached by mid-year 2014 at the latest!
|
„As far as I know", the GUNNER24 Forecasting Method is the globally unique and only technical analysis tool that deals intensely with the comportment of the market at support and resistance marks being able to combine that with price predictions. You’ll learn everything on these really "secret" facts in the Complete GUNNER24 Forecasting and Trading Course. Order now!
Be prepared!
Eduard Altmann


