Ride the parabolic move with the Advanced GUNNER24 Setups
Prices often make one last parabolic move, known in technical analysis as a climax, when the largest gains/drops in the shortest periods often occur. With the Advanced GUNNER24 Setups frequently we can find out the moment when the price begins to run off.
The same, with that advanced price and time technique we can see when we should close our positions in order not to reduce our profits or simply when to earn them because the parabolic move draws to an end irrevocably.
As an example for the maximum advantage of a parabolic move let's just have a look at the pair EUR/USD in the 4 hour chart:
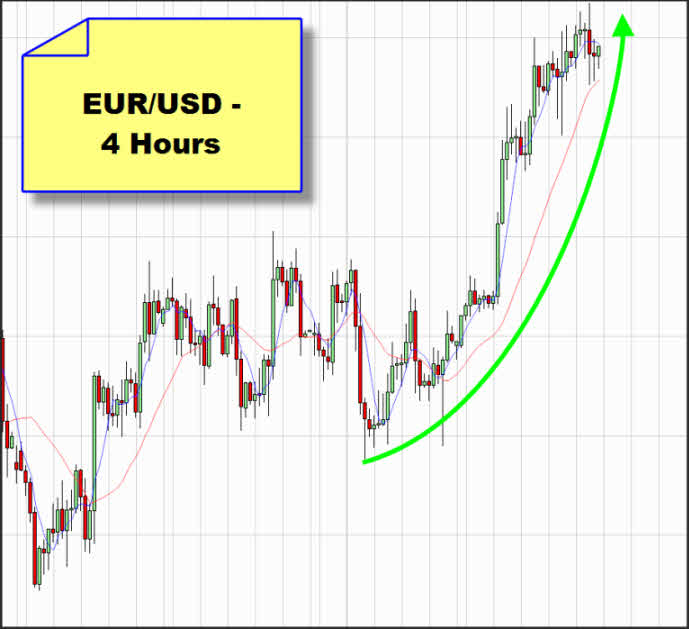
Here, a parabolic move at the pair is to be recognized very well. We often see the parabolic move at the end of a swing, mostly preparing a quick change in trend. Two most important questions always asked by the investors and traders are:
1. At what moment do I know that a parabolic move is coming in? And
2. When is the parabolic move over?
==> There is only one technique in the world that is able to answer both questions: The use of the Advanced GUNNER24 Setups.
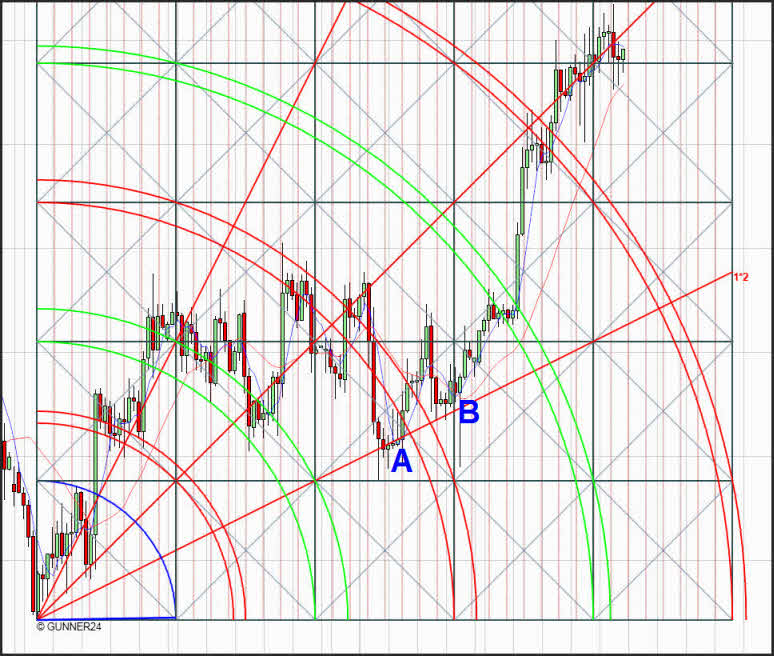
Let's apply now our 9 Candle GUNNER24 Up Setup. Both long entry signals at A and B are to be made out even by the beginners under the GUNNER24 Traders. In both occasions, the trading action is taking place due to the rule 24.2 (Gann Angle Retracement).
In the further analysis, we are going to apply the advanced GUNNER24 Techniques to find some support for the positive price performance at a double arc.
With a little bit of exercise and dealing frequently with the GUNNER24 you may come across this interesting price and time connection.
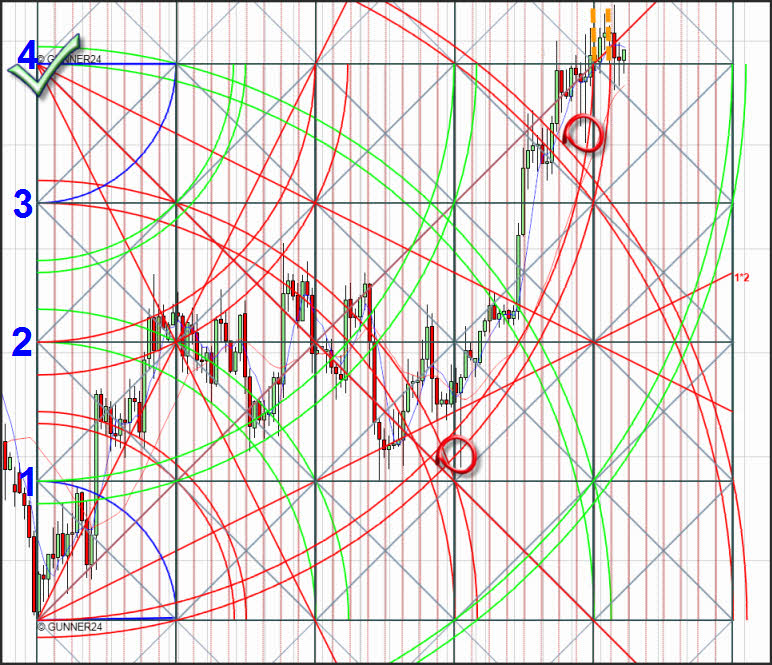
We put the counter setup above the original setup. That's what we do at the beginning of the original GUNNER24 Setup, yet the starting point of the counter setup is four squares higher (green hook).
We see that the price at both red marks is undoubtedly backed by a double arc. Both are beautiful spike candles which allow us to recognize the strength of the 4th red counter double arc.
Considering now the isolated Counter GUNNER24 Setup we can see many things in an easier way:
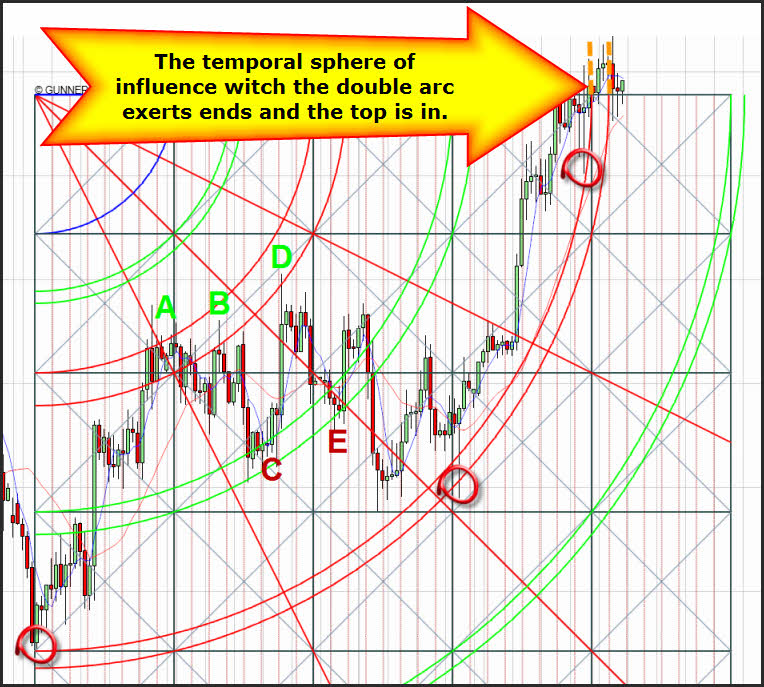
Isn't it interesting to see the price at red A, B and D being braked by the red double arc whereas at red C and E the green double arc is providing support. After the latter is broken the price is finding strong support closely above the red double arc of the counter setup. Then it's working its way upwards with that double arc.
But that's where the parabolic move is drawing to an end. See the dotted orange lines. With our techniques we know when to cover. Here the temporal sphere of influence which the double arc exerts ends, and the top is in.
See our most important rule 15, by the way: Around that area of influence, and shortly in front of it or shortly behind it you will ALWAYS have to get ready for a change in trend and be able to join trading the new trend.
A brief comment on the stock markets: Last week was absolutely uneventful again. The established price and time forecasts of the markets which had been elaborated in the former issues did not change.
You may study the detailed GUNNER24 Forecasts on the American stock markets:
- Dow Jones (GUNNER24 Forecasts, Issue 01/10/2010).
- NASDAQ 100 and S&P 500 (GUNNER24 Forecasts, Issue 01/03/2010).
Be prepared!
Eduard Altmann

