Whereas the most recent course of the common currency since May 2014 developed terrible yet – 2015 is supposed to become truly dreadful.
In my opinion, in 2015 at least the parity with the US$ is likely to be achieved. A EUR/USD at 0.95 to even 0.90 are in easy reach now, as early as within the next 12 months. The "conventional" chart analysis and some important aspects of seasonality as well as the GUNNER24 Forecasting Method are now clearly implying such an outcome in unison.
The worst feeling respectively the bad thought I had during the preparation of the following EUR/USD analysis is the circumstance that – as a rule - the markets use to price in the foreseeable future, in this case the parity of the Euro with the US$ respectively the 0.95-0.90.
==> So, for me the big question is pending: What is actually going to happen with the European anchor currency if something unlooked-for occurs, something the markets cannot divine yet?
In other words, what will happen to Europe if another unknown quantity, another negative surprise intervenes in the play, besides the already falling dominos such as incapable, illogical and idle leadership, bloated bureaucracy, inefficient money politics, Euro glut, Draghi’s Madness, sanctions, deflation, recession probability, Grexit, foreseeable new Greece haircut, bottomless Ukraine pit, lack of social structure, arising ethnic tensions etc.? Will we perhaps see in that case the 0.80 or even lower…??!
What will a thoroughly conceivable EUR/USD at 0.90 or even 0.80 bring about here in the Euro area with the population and the mass media and political leaders that are operating absolutely panic-stricken being losing it completely? One is being filled with horror in front of the near and far future, isn’t one?
Those who are truly horror-stricken by the Euro now is the Big Money. From May 2014 they were selling off normally but steadily the EUR/USD, whereas with December 2014 – in my opinion - a panic selling wave began… seeming to be about similar to the current oil sell-off in terms of trend-strength and -course:
The big investors are operating now as to the motto: "If you’re going to panic, panic early!"
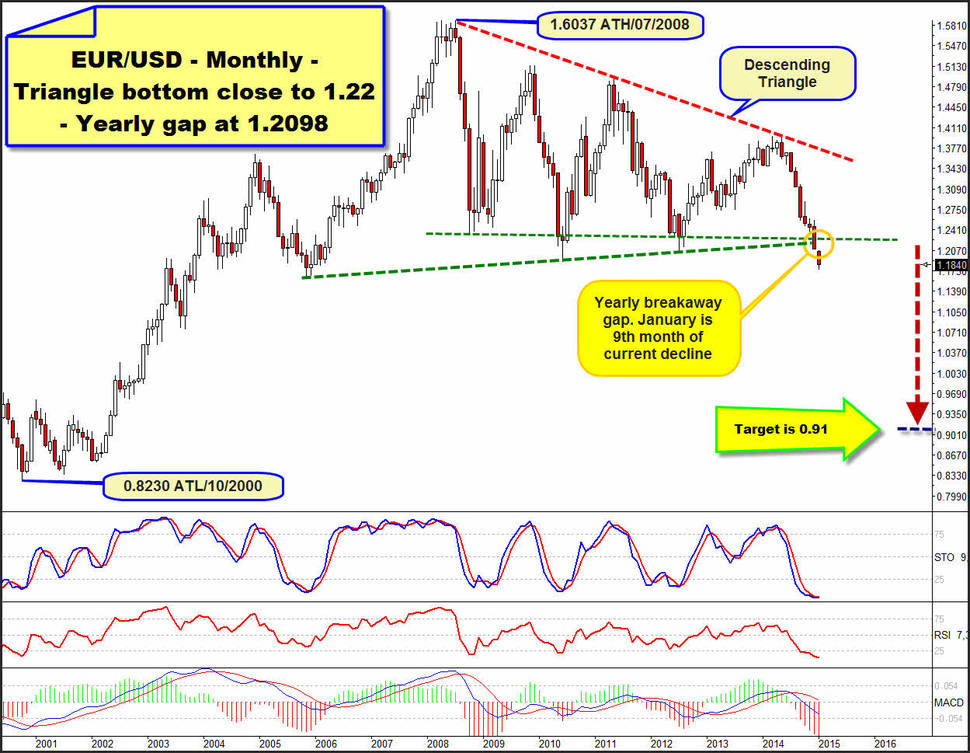
From the all-time low (ATL) of the year 2000, the EUR/USD rose by almost a 100% into the 2008 all-time high (ATH). From 2008-2014, a descending triangle was formed whose support was broken downwards with the December 2014 close being certainly confirmed its support break by the January course so far.
The simple chart arithmetic is now putting out that the pair is likely to target the 0.90 area now ==> the downtarget resulting from the triangle break is at about 0.91. Thus, the 0.91 is the target the market is aiming at because it is pricing in the current developments in the Euro area. It will go lower if new terrors are revealed respectively new discords gape.
The current decline on monthly base is supposed to go on for at least 4 more months since the present decline wave is in its 9th month in January 2015. Since this 9th month reached a lower low than the 8th month did, we will have to work on the assumption that the decline cannot mark an important/final low before the 13th month of the current decline. Whether the current selling-wave will come to its final end in the 13th month of its decline, is a matter of waiting and seeing. May 2015 would be the 13th wave of the decline.
Furthermore, the chart-technical experiance impls that after a break of a triangle mostly follow some hefty moves, trend moves. We are talking about a descending triangle that had shaped over more than 6 years. The very long duration of the consolidation is pointing to a hefty long-lasting future downmove, stable in trend. I.e., rendered to the pair: A quick and deep sell-off is now actually to be expected respectively highly probable… comparable with the current oil sell-off.
Regarding the signaling and fore of trend of the further sell-off course, the time factor is playing now an elementary part. December 2014 broke the triangle support on closing base. January opened with a gap. Thereby the first trading day of the year 2015 opened with a gap beneath the triangle support… and thus below a topping formation that extended over more than 6 years.
Thus we can state that the changeover from 2014 to 2015 = time, released a tightening of the current trend. Thereby, the arisen gap seems to be matter of a breakaway gap. The emergence of a breakaway gap at a yearly changeover is a yearly breakaway gap. This is hefty, indicating a trend year. Here, the year high is at the beginning of the year (January/February), and the price low of the year is likely to arrive by the end of the year (November/December).
If the pair in 2015 happens to close near the year low we’ll have to expect that the current downtrend move will thoroughly go on producing more lower lows even after the 13th month of the decline, the current decline wave then at least being allowed to last about 21 months. ==> In January 2016, the current decline wave would be in its 21st month then.
With the triangle break in December we also have to state now that since 07/2008 and the 1.6037 ATH the EUR/USD is in the 79th month of a bear market. Next reachable Fibonacci number that is suitable for a change respectively for an important low is thereby the 89. ==> In November 2015 the bear market will be in its 89th month then.
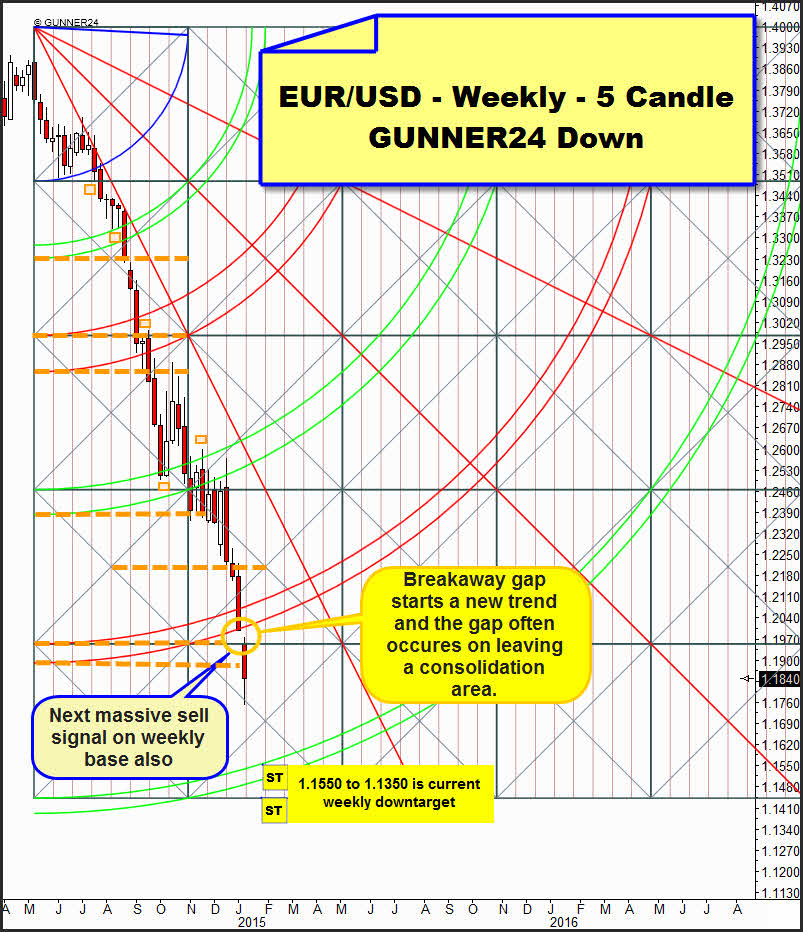
The weekly time frame is likewise showing a gap near the turn of the year:
In the currently valid 5 Candle GUNNER24 Down, the very first complete trading week of the year 2015 likewise opened with a down gap. Whereas the week of the year crossover 12/29/2014-01/02/2015 still closed exactly on the lower line of the 4th double arc, a weekly support, the opening of the very first complete trading week of the year newly generated a hefty sell signal on weekly base with target upper line of the 5th double arc respectively lower end of the down setup in terms of price. For the time being, the first trading week in 2015 activated thereby the 1.1550 to 1.1350 area in the weekly time frame for the current sell-off.
Thus, at the turn of the year, the EUR/USD did not only produce a monthly, but also a yearly down gap. The weekly time frame did so as well. Only the clear statement is left that all three important signaling time frames = the factor time, imply further hardship to come respectively absolute panic, since breakaway gaps really always trigger a new trend (in this case certainly the panic cycle), because they mostly appear when a consolidation area is being left.
An important seasonality aspect joins in by consideration and future expectation conduct. It’s the fact that in 20 out of the last 21 years the EuroFX ALWAYS IN JANUARY formed either its absolut year high or its absolute year low. The same is accurate for the US$ Index (but opposite). It’s an unambiguous powerful seasonality-inevitability that has no equal in the financial markets being in conjunction with the current GUNNER24 Down Setup on monthly base, actually permits one only conclusion: The Euro is certainly going to mark its absolute 2015 year high in this month of January and keep on falling, lower and lower…
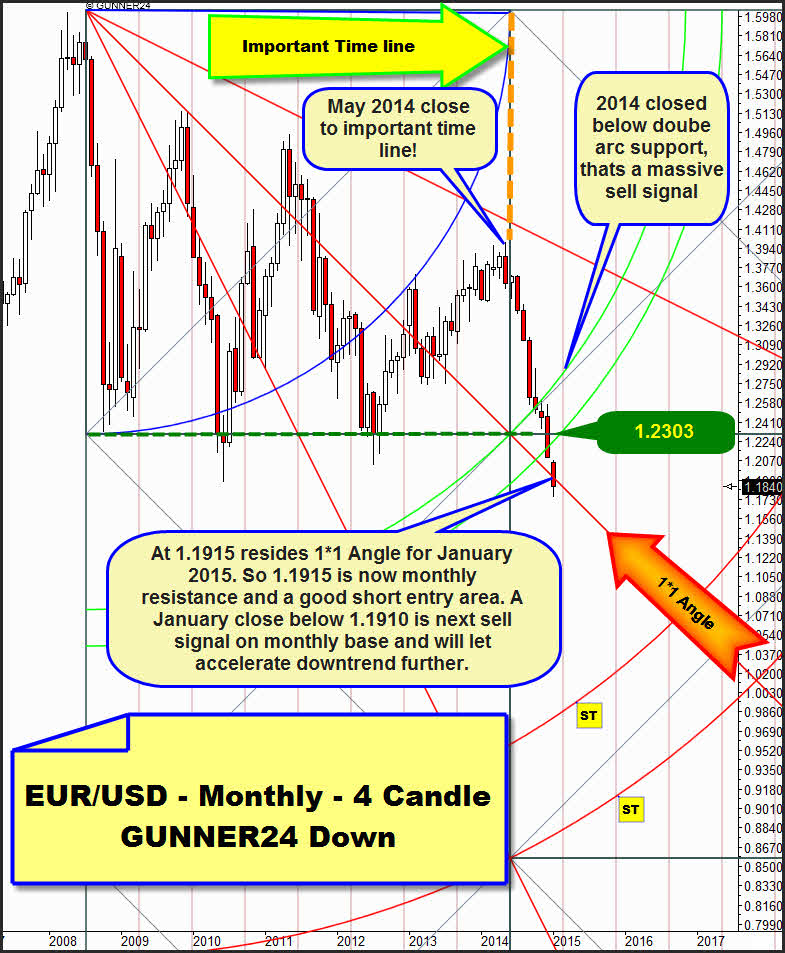
At the ATH we measure 4 months downwards. That`s the initial impulse, the very first wave of the current bear market. Therewith the future supports and resistances are established.
For many years, the first square line support held. Important turns were triggered by the long-standing 1.2303 horizontal support. Until December 2014, the first square line held. December 2014 closed at the absolute monthly low.
Well, correspondingly, the entire year 2014 closed at the absolute yearly low. The consequently presenting signal is unequivocal: EUR/USD thereby closed strong in trend beneath the lower line of the 1st double arc. Thus, the upper line of the 2nd double arc is activated as next important downtarget in the monthly time frame, being likely at more than a 75% to be reached within the presently running downmove.
The December close 2014 below the lower line of the 1st double arc made the current decline accelerate in terms of its trend force. The torn breakaway gap at the beginning of the year – well, it tore near and beneath the lower line of the 1st = last important support on monthly base – confirmed that the pair is supposed to go on falling rapidly now. Obviously there is more and more downwards energy developing now.
January 2015 is already trading now below the important 1*1 Angle support that takes its course at 1.1915. A monthly close below the 1*1 Angle – this one is very likely till February 2015 and indeed compellingly necessary since the weekly time frame has the 1.1550-1.1350 as target… - will add fuel to the flames since a further intensification of the sell-off is/should be going with it.
That’s why I reckon that the upper line of the 2nd double arc may thereby easily be reached as early as in 2015 – between 0.98 and parity, depending on the month. We can suppose that the panic cycle that began in December 2014 will have to work off the 0.90 at the lower line of the 2nd. Thus, the simple chart-technique clearly fits to the GUNNER24 Method according to the 0.90 downtarget.
Be a part of our exclusive sworn GUNNER24 Trader Community – now... I try to protect your wealth!
- with daily trades – quick, safe and profitable…
- in well-chosen precious metals, commodities, indexes, currencies and in the best stocks worldwide...
- in both rising and falling markets…
- with little use of capital…
Be prepared!
Eduard Altmann


