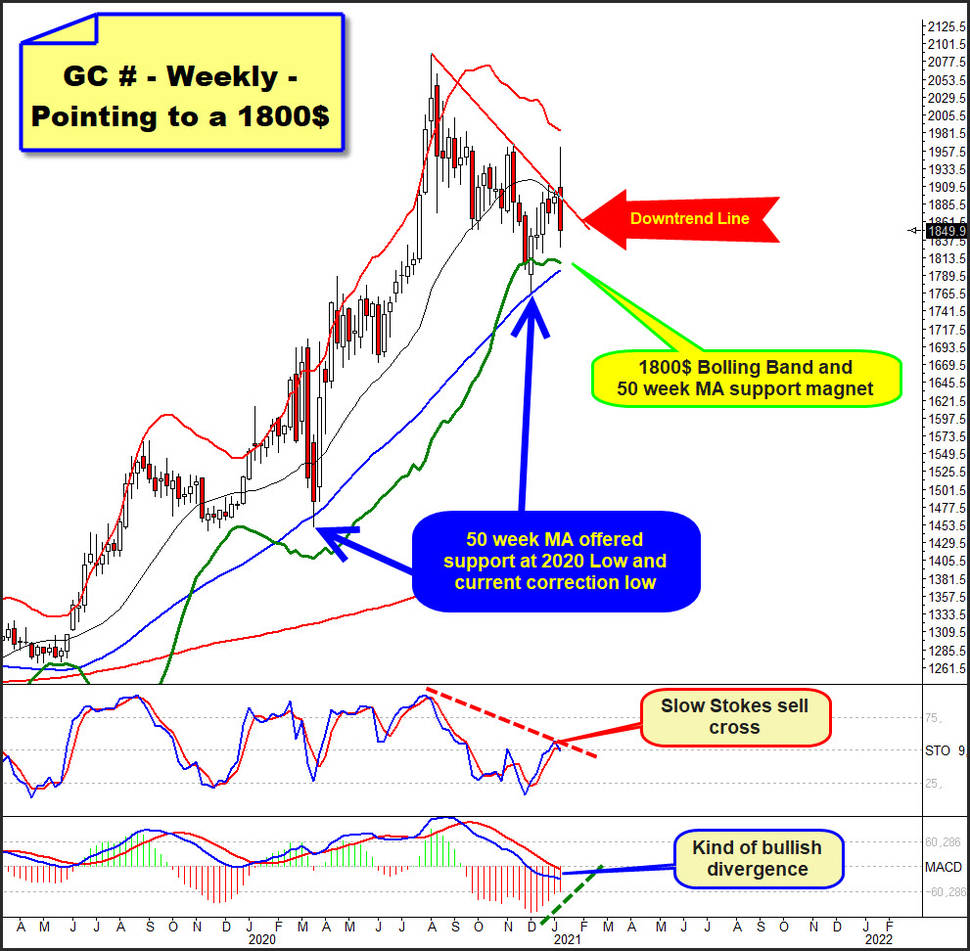
Friday’s violent drop in the price of gold created serious damage. Note in the technical weekly chart below how the red trendline is resistance again. Another epic failure after the new year 2021 first did a yearly opening gap and this triggered a short-lived rally into a 1962.5$, this year spike high. Silver as the Miners also failed a bullish breakout. This is not a pretty picture.
Ugly reversal candle is in for the very first week candle of the new 2021. The week candle has an unusual long upper wick what signals short-term bullish exhaustion and Big Whale selling starting at so far year highs.
Another sell cross for the weekly Slow Stokes is made, confirming since the August 2020 alltime-high the more shortterm oriented momentum remains in a downtrend. If gold continues to brake down early next week the odds of testing the combined support of the 50 week MA and the lower Bollinger Band support at round 1800$ increase dramatically!
To sum it up: Stronger chart damage is created. Golds points to that the corrective cycle which started at the August 2020 alltime-high will have to continue for a few more months before it will come to an end. I think, final correction lows could come at the end of March or early April..., and the yearly 1722$ GUNNER24 Horizontal Support could influence the final correction lows.
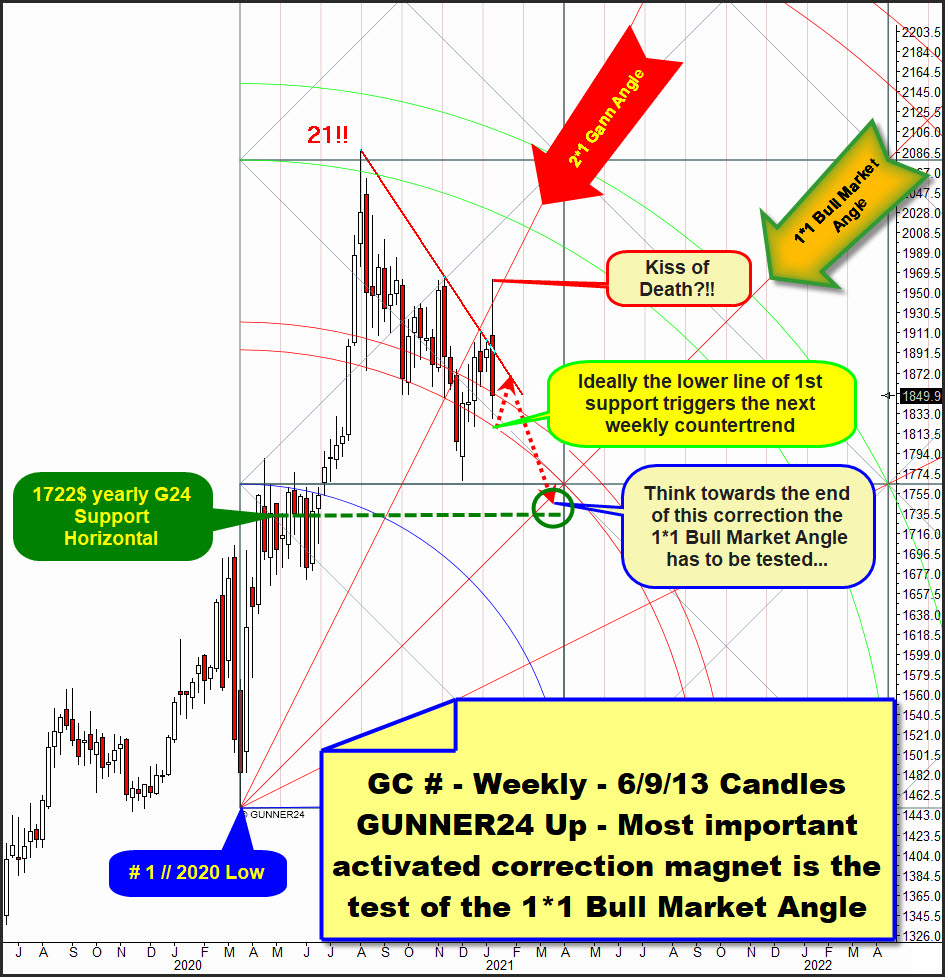
For my hard GUNNER24 Call, we anchor this often presented and analyzed weekly 6/9/13 Candles GUNNER24 Up Setup, starting at # 1 // final 2020 Low, a next higher important overall bull market low:
Gold has been in a very bullish uptrend since mid-March 2020 but topped after a to the 21 Fib number oriented rally cycle into final high of 2020 what is current alltime-high. The 2020 rally highs have worked off natural lower line of 2nd double arc and the natural given bear energy of the 2nd double arc, especially of the lower line of 2nd double arc triggered the downtrend cycle.
NOW!!! we should expect the 1*1 Bull Market Angle has to be tested in course of the corrective cycle. The 1*1 Gann Angle became official important W.D. Gann Angle downtarget as during the correction the fromer 2*1 Angle support gave away finally on a weekly closing base.
Next, watch this week candle bearish spike high!
This looks like an ugly negative backtest of the now as big, big main resistance confirmed 2*1 Gann Angle. We have technical terms for such ugly negative backtests. In chartology we name it a false breakout or it is a „Kiss of Death" in terms of price/time trading.
Gann Angles are always both, magnets in terms of price and time. And a possible Kiss of Death caused by an important Gann Angle on yearly base (2*1 as 1*1 in this weekly gold case is a yearly stuff cause they spring from the final low of 2020) EXACTLY after the turn of the year – which per se is always an important time magnet on a yearly base – STRONGLY points to the outcome that this monthslong corrective cycle sometimes has to test the 1*1 Bull Market Angle in downtrend direction.
And ideally the 1*1 Bull Market Angle testing comes true towards the end of the monthslong corrective cycle.
==> The negative end of the first trading week of 2021 now strongly confirmed that the 1*1 Gann Angle should be tested during this corrective cycle and above in the chart I`ve highlighted the probably necessary possible path for the likely due 1*1 Bull Angle test. This is represented by the two red-dotted arrows.
First, I expect the gold to bounce back into determining red-lined downtrend main resistance towards end of January to early February time turn window for the classic backtest of the yearly 1872$ GUNNER24 Main Resistance horizontal.
Such another next backtest of the channel resistance line should trigger the LAST, approx. 8 weeks long, downward cycle = final washout cycle by end of March to early-April and at the end of this scenario the yearly 1722$ GUNNER24 Main Support horizontal & the yearly 1*1 Bull Angle support should simultaneously trigger the final lows of the correction towards end of March to early-April..., followed by a next multi-month long bull market cycle that should hammer fresh alltime-highs later in 2021.
Usually the 1820$-1822$ GUNNER24 Support Magnet should be strong enough to trigger a next shortterm low and a 10 to 13 trading days countertrend for the backtest of the 1872$ surroundings by late-January/early-February.
Hmm, in case the 1820$-1822$ fails to hold at next test, expect the rapid downtrend continuation into above identified 1800$ 50 week MA and weekly Bollinger Band support magnet!
Gold started a move to overcome it`s weekly channel resistance, and Friday`s price action postponed this. Postponed it considerably.
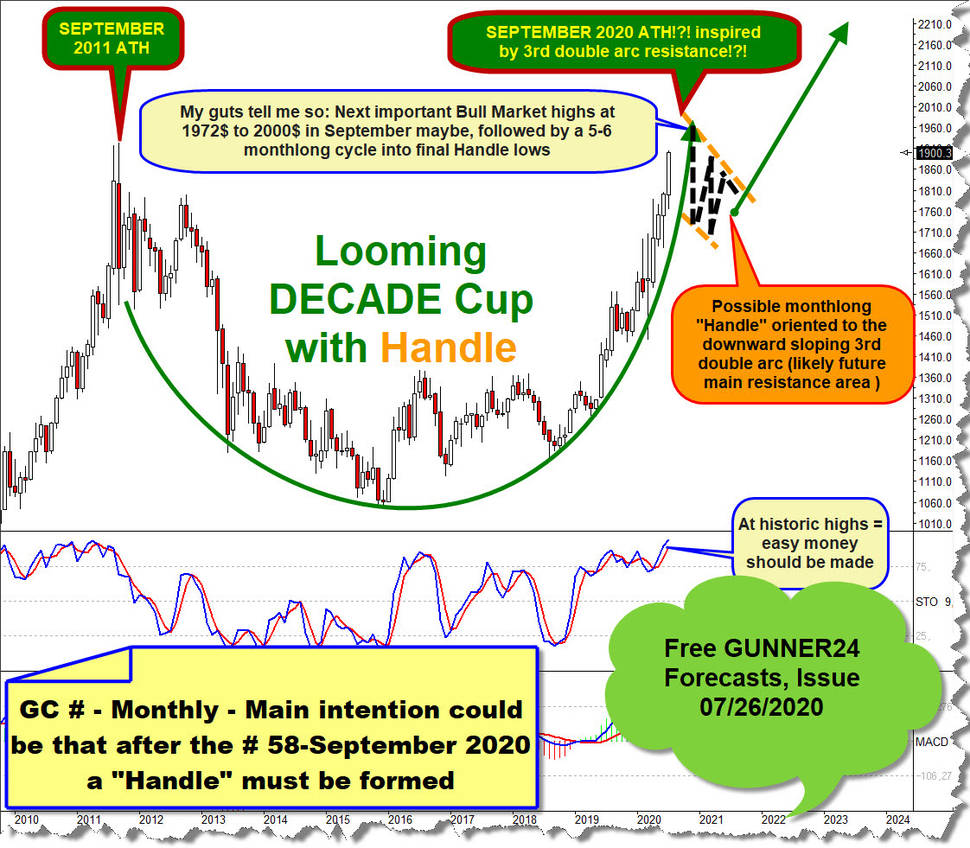
The monthly chart now shows, better, confirmed that the gold will probably have to continue to work on its multi-month Handle pattern.
Lastly, I expected with regard to this topic that the Handle should unfold for 5 to 6 month candles:
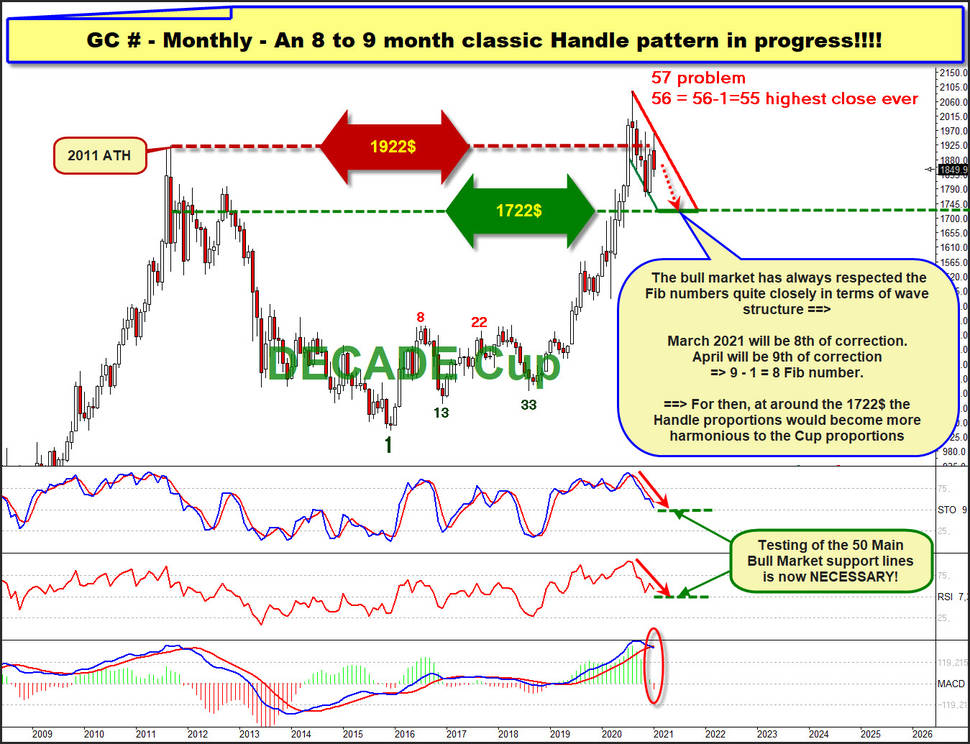
After Friday we do know that this chart and the Handle needs time, some more months, before it can do any magic! Past year top and alltime-high and this year high, IMHO, now form the most important future resistance to overcome! This redline Handle resistance:
==> normally, the determining angle of the Handle resistance has only just manifested itself with the highs of this week/this year! Red-lined Handle resistance above is now a confirmed yearly resistance rail, defined by last year high/alltime-high and this year high.
This and the BEAR EVENT that the 1922$ yearly GUNNER24 Main Resistance Horizontal, what is in full sync to major important 2011 alltime-high, wasn`t overcome by year 2020 close, what actually means, the new 2020-2029 DECADE denied to close above the highest price of the last DECADE, should continue to exert stronger bearish pressure on gold in the weeks and months ahead.
There are two time features of this chart to note. The Handle correction runs for 6 month candles, but this is still exceptionally short in time compared to the number months of prior formed DECADE cup.
To some degree it's always about „proportional" time and price. And final Handle lows influenced by the MAJOR STRONG 1722$ yearly support made at lows of March 2021, what then will be the # 8-Fib number month of the Handle correction, respective final Handle lows sometime over the course of # 9-April 2021 - 1 = 8 Fib number month of the Handle correction would make the Handle proportions look much more harmonious with the fixed DECADE Cup proportions.
An 8 to 9 month corrective Handle would fit quite well with the previous wave structure of this bull market, which started at the end of 2015 at the Big Green 1, and whose main waves have always been almost exactly aligned to the Fib numbers of the current running Fib numbers sequence. 1-low, 8-top, major higher 13-low, important top at 22, next major higher low at 33, big top influenced by the often major important 55-trend turn number
==> 98%-likely the Handle correction has to run for at least 8 month candles!
You best register with our GUNNER24 Gold Trader now. That’s where we oversee the optimal entries and exits for you. Especially in the difficult market situations where many factors have to be considered the Gold Trader is backed by the additional GUNNER24 Signals based on the combined 1, 4 and 8 hour setups to catch the optimum entries and exits.
The GUNNER24 Gold Trader will provide you with the critical knowledge you need to forecast and analyse the precious metals with the GUNNER24 Forecasting Method. All the GUNNER24 Trading Signals you receive real-time are based on the actual Gold and Silver Future. The NEW GUNNER24 Gold Trader is a must for every actively working investor and trader who wants to trade successfully in everyday trading. The insights you receive from the head trader Eduard Altmann (and discoverer of the GUNNER24 Forecasting Method) are truly amazing sometimes. I promise!
Click the button below and order the GUNNER24 Gold Trader - $39.90 US a month. For 201 members and up - $49.90 US a month.
Be prepared!
Eduard Altmann


