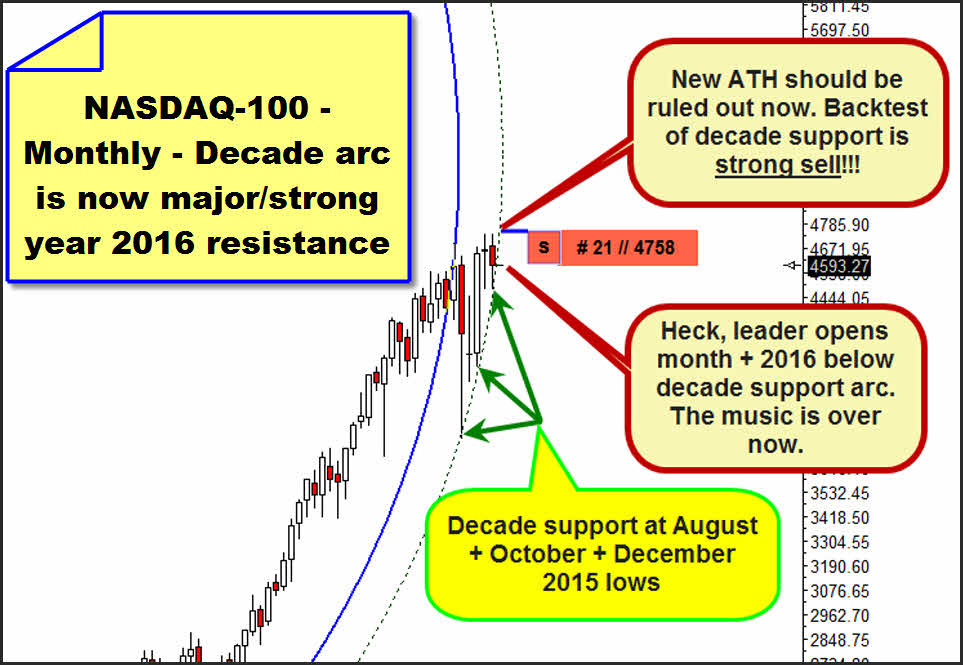
Last Sunday, I prepared you for the currently most important support for all the Western stock markets to break by the beginning of the year. It is matter of an arc of the NASDAQ-100 in the monthly time frame with starting point at the bear low of the year 2002. During the 2015 August + October + December lows, this arc upheld several times successfully resp. it was tested successfully. For brushing-up generally, here again the index state at the December close:
Time after time, it’s interesting to observe what imposing downwards forces may arise when a long-upholding support – the decade-support arc though had backed the NASDAQ-100 for as many as 13 years! – gets lost.
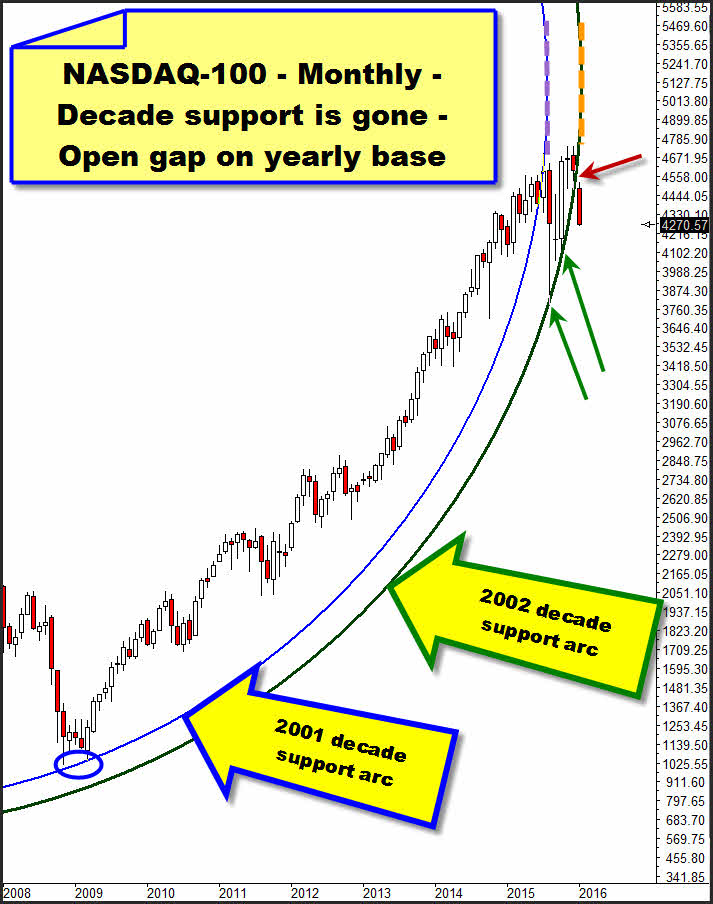
What makes/made the whole thing even worse is certainly the loss of the decade support at the beginning of a completely new trading year accompanied by the fact that in addition a downside gap ensued at the beginning of the year. Thereby, the Western stock markets "may" have to deal now with a breakaway gap on yearly base:
The loss of a decade support accompanied by a possible yearly breakaway gap – red arrow above – is an occurrence A) that is out of my own experience (20 years), B) that rather certainly happened extremely seldom over the last few decades and C) whose medium- resp. long-term consequences are quite difficult to assess at the moment. So far, I had worked on the assumption that the loss of the 2002 decade support arc can only signify the beginning of the long-expected 3-5 month correction in the bull market…
…about that substantial (just correction in the trend…) as the loss of the 2001 decade support arc was, likewise sketched in the chart above. This decade support arc’s origin is at the important year 2001 bear low, it was confirmed by the 2009 low – please mind about this the blue oval test, marked above – losing its support effect with the August 2015 opening. The maximum extension of the 2001 decade support arc I visualized with the dotted purple vertical…
…and its loss was the trigger for the "surprising" August 2015 sell-off month that again was stopped by the 2002 decade support arc.
So once more:
==> On the tick at the start of the new trading year, it came to the loss of a support that had upheld for 13 years, accompanied by a downside gap – a possible breakaway gap on yearly base.
==> I think, this means now utterly danger for the bulls. With the opening of the new year it even may have come to a complete change in trend, since breakaway gaps mostly start a new trend, and the gap often occurs on leaving a consolidation area just as were currently present in the case of most broader US stock market indexes!
==> This means: The current bull-run may be over now, a new bear market on monthly base in the secular bull market may have begun with the year start. Based on experience, those ones use to last about 6 to 24 months!
==> My urgent advice is now: For the time being, completely get out of the medium- and long-term structured stock investments till the monthly time frame fires an unambiguous buy signal. This story may end pretty evilly for the stock bulls.
Now we come to the fine analysis of the current panic move.
Thereby follow the answers to the questions when and where S&P 500 and NASDAQ-100 are supposed to deliver their respective panic lows starting to turn? Where are situated their first bounce targets that might be reached after the panic lows? And also: Where are the very first downtargets of the now started downwards move/correction resp. even a newly started downtrend in the monthly time frame?
Mostly/empirically panic moves last 7 to 10 trading days before bottoming – as to the rule. Anyway, as mentioned above, the loss of a decade support accompanied by a yearly downside gap is something rather rare, so the panic wave may extend in terms of time. As to my interpretation of the market performance, the current panic move starts one day after reaching the Xmas-rally highs, on 12/30/2015 resp. – alternatively – on the very first trading day 2016.
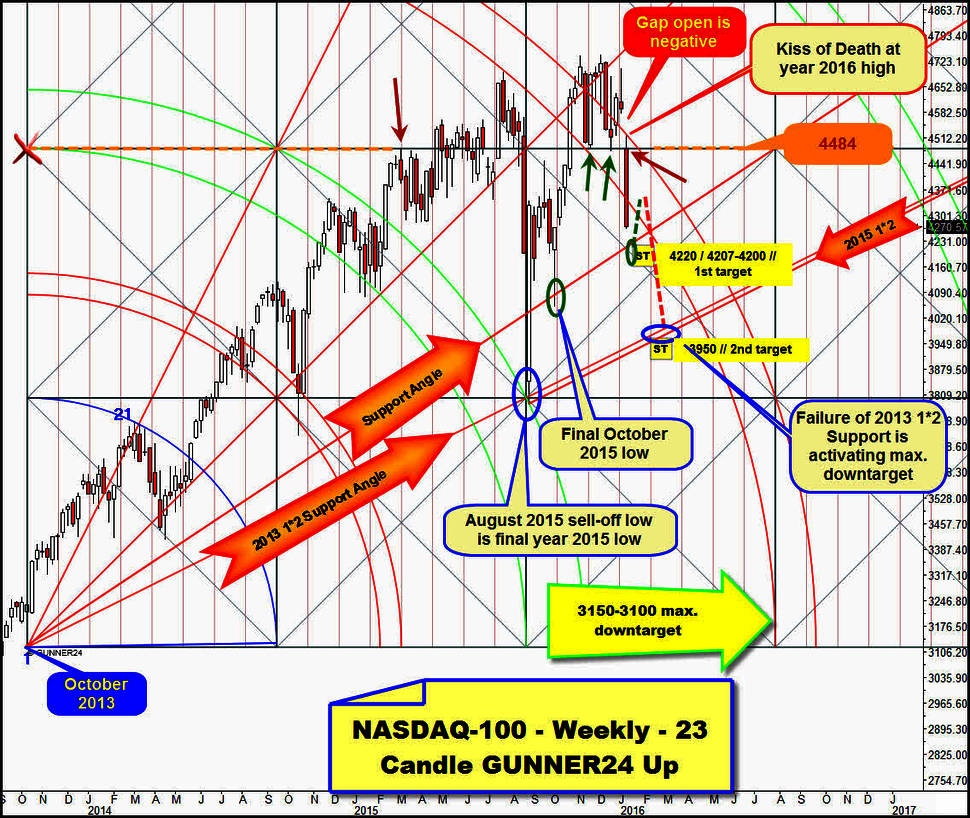
This may be, about this, please mind the classical Kiss of Death exactly with the year high 2016 at the upper line of the 3rd double arc resistance line in the very long-term weekly 23 Candle up of the NASDAQ-100 starting at the important October low of the year 2013.
The coming Monday, thereby the stock markets are either at the 7th day already or just at the 5th day of their panic wave. In any case, both interpretations would mean that normally one day or other in the course of next week the final low of the panic wave is supposed to be reached. Since there were not to be seen really high selling volumes before 01/04, technically the markets should not bottom before Wednesday, at the latest on Monday, January 18.
In the weekly GUNNER24 Up Setup above, we perceive this: Even though the NASDAQ-100 was able to generate a couple of closings above the 3rd double arc, it was a false buy signal, at least in the medium term.
Well, the first week of the new year closed far below the 3rd double arc support area at the weekly low thus generating a clear GUNNER24 Sell Signal in the weekly time frame: ==> First downtarget is thereby the next test of the Support Angle. This one is technically supposed to be reached/worked off next week already – 95% of probability.
The Support Angle was penetrated by about 15 pts with its first test at the final October 2015 low. For next week, the Support Angle takes its course at 4222. 15 pts of penetration (W.D. Gann’s losst motion) result in 4207. 4207 is near the "round" 4200. Thereby, I think that the upcoming low of the panic wave perhaps wants to attain the 4200 as well. So, likely 1st target is at about 4220-4200!
Afterwards, a sharp but brief short-covering rally is expected to ensue going at least into the resistance area that now exists between the lower and the upper line of the 3rd double arc.
==> At least 4320, rather 4350 as bounce targets.
From there, technically it can only go down again till the next test (2nd) of the 1*2 Support Angle proceeding from the October 2013 low. At the important August 2015 sell-off low, this 2013 1*2 Support Angle upheld, together with the upper line of the 2nd double arc support, and that’s where also the 2nd downtarget of this very first downtrend wave is situated. Watch the two blue ovals for that critical year 2016 support = also strong downside magnet currently!
Important signaling: If next week closes below the Support Angle already = 4200, without too much counter reaction, the index will technically have to keep on falling into the 2013 1*2 Support Angle reaching it/working it off swiftly, at 3920 then, until the end of January 2016!
Together with the 1*2 Angle to be derived from the August 2015 low (2015 1*2), the 2013 1*2 Support Angle forms the absolutely strongest support for the entire year 2016! The August 2015 low is matter of the absolute low of the year 2015. If this combined important Gann Angle support area breaks – I’ll say Goodnight, dear bulls. In that case, the 3150 to 3100 region will be activated as maximally possible downtarget of a bear market in the monthly downtrend!
For now, we should be prepared however for the 2013 1*2 Support Angle together with the 2015 1*2 to stop this new downtrend, starting there, at the combined Gann Angle support area a first powerful countertrend.
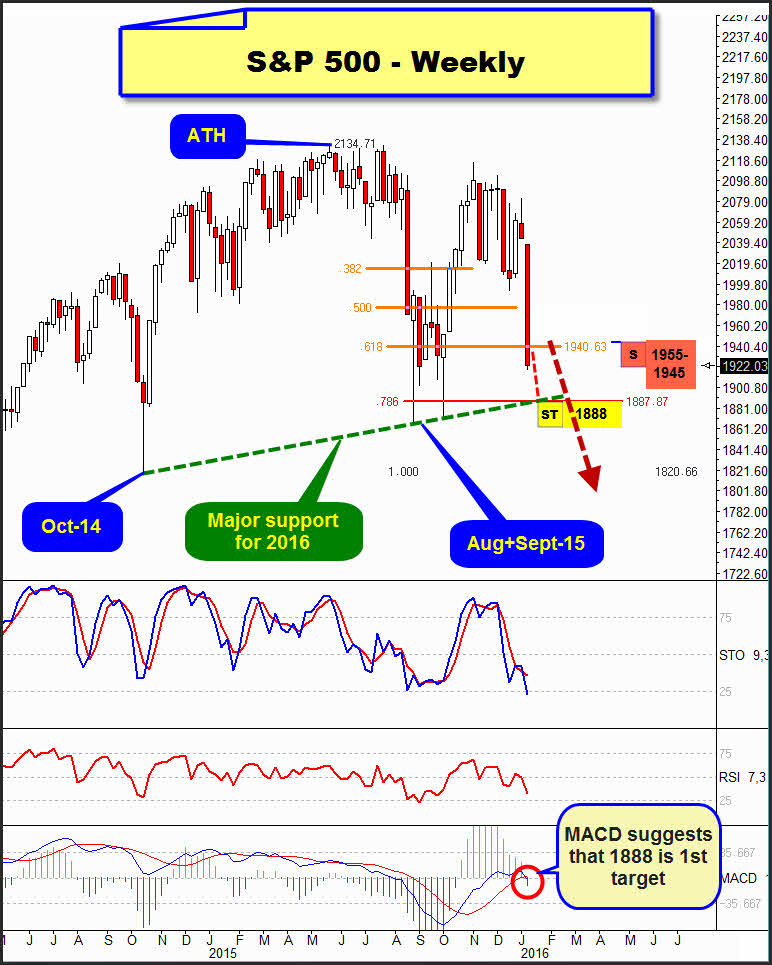
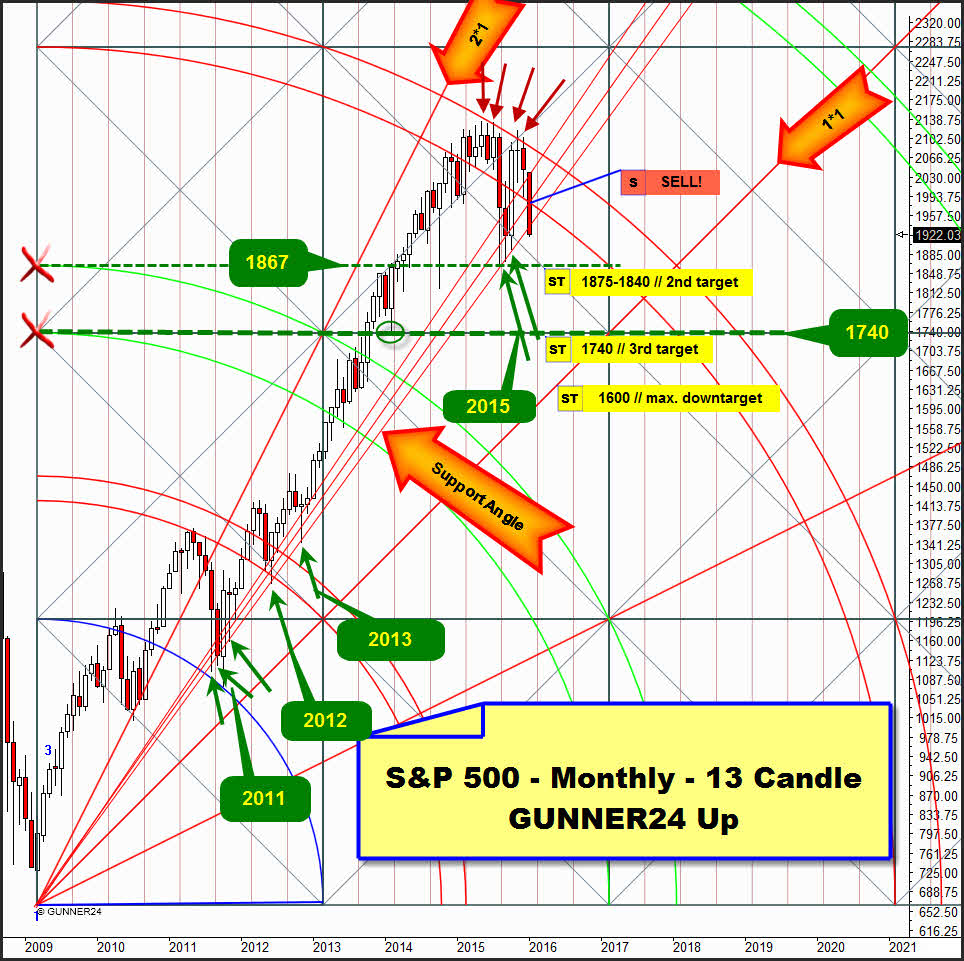
With its 1922.03 closing of the first trading week, the S&P 500 lost the critical 61.8% Fib retracement support, thereby activating round about 1888 as an end of the 7-10 day panic wave:
The 78.6% Fib retracement of the up move that started at the October 2014 low going into the all-time high (ATH) takes its course at 1888. Together with the major support, there at 1888 the 78.6% retracement forms a strong stopping point = support magnet for the current panic!
The major support is matter of the connection of three important lows beginning at the October 2014 low. The major support is a very important support for the year 2016.
After the 1888 support magnet being reached in the course of the coming week – probability of a 95% – a sharp, but brief structured short-covering rally is supposed to ensue that should have to test back the important 61.8% retracement – most likely exceeding it scarcely.
==> So at least 1941, but rather 1955-1945 as bounce targets, there and then short for the 2nd downtarget:
This 2nd downtarget is at 1875-1840 being a monthly target.
The GUNNER24 Methods applied to the monthly time frame signals that the market is in free fall. The new year + the January 2016 candle start with the possible breakaway gap at a Gann Angle within the lines of the 3rd double arc that is now clearly to be assessed as monthly and yearly resistance…
==> The upper line of the 3rd is thus ATH resistance for the whole year 2016 – and all the following. Thereby, the 3rd double arc has developed strong downforces. Just as it did during the August 2015 sell-off wave!
At the "SELL"- note anchored in the chart above, the market broke through the support of the lower line of te 3rd. Even more down energy was released.
The Support Angle that had been tested successfully several times in 2011, once in 2012 and 3x in 2015 at important monthly lows (August + September + October) was fallen short rather clearly with the 1922.03 closing price on Friday. This youngest violation of this MOST IMPORTANT bull market support trail is technically another strong sell signal that should release further downforces resp. sell-off power!!
==> The 1888 at the major 2016 support may detain the free fall, but actually by no means end it, as to the signal of GUNNER24 in the monthly time frame.
==> There’s simply nothing left between 1922 and 1867 in the monthly time frame!!!! So, technically the August and September 2015 low environment resp. the October 2014 low environment will have to emit mighty magnetic attraction force!
Actually, the first thrilling question is just whether or not this important support area will also resist at the next, the third test. Fifty/fifty I’d gage the odds at the moment.
==> After the GUNNER24 Body of Rules, by all means, a monthly close below the important 1867-GUNNER24 Support Horizontal will activate the GUNNER24 Support Horizontal at 1740 as 3rd downtarget target for this trend move in the monthly time frame.
==> Besides, the maximum downtarget for a new bear market with a duration of 6 to 24 months – given that the emerged yearly opening gap is really the trigger for such a bear market – is due to the final working off the 1*1 Angle being the most important + most powerful + last secular bull market support. In 6 months, the 1*1 Angle takes course at about 1600 = maximum downtarget.
Be prepared!
Eduard Altmann

