Welcome to the first GUNNER24 Forecast in the New Year. As forecasted, the gold declined into December 2017 FOMC meeting, to start a strong turnaround at the anticipated next higher 1-year-cycle low.
Gold was expected to test 1222-1220 yearly GUNNER24 Support Horizontal at December 2017 low, with the option to retest the "round" 1200 if the major 1222-1220 support will not last.
Finally, the metal bottomed one trading day before the FOMC meeting on 12/12 at 1238.30$.
Regarding my latest, very detailed forecast into the meeting please look up here.
Since then, gold has risen almost 100$ again, showing a positive start to the new year, as it has been the case for the last two years 2016 + 2017. So, the uptrend out of next higher 1-year-cycle low is a stronger one and behaves as it should be according price. So far so good. Now let's look at how the gold is in the big picture. What signals it sends out. What it may be. For the entire trading year 2018 but also at short notice.
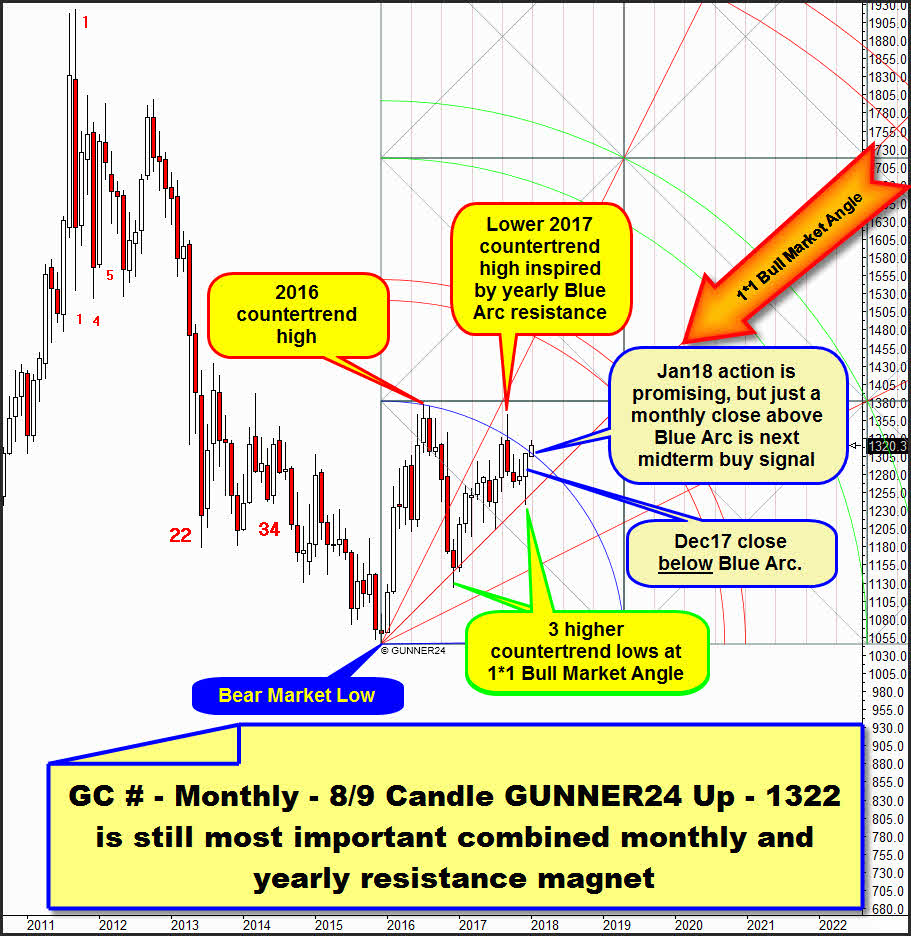
Let`s start the outlook with the still everything dominating circular 8/9 Candle up in the monthly scale. The up setup above starts at 2015 Bear Market Low extending up to the 2016 uptrend highs. Since the 2016 highs, gold has been correcting the ascent during 8 resp. 9 monthly candles from the bear market low.
Main resistance for gold is the Blue Arc which was cemented as combined monthly and yearly major resistance by 2016 countertrend high and the small lower countertrend high made at 2. Also bullish 2017 extreme was inspired by the Blue Arc resistance. 2017 top is a lower high compared to 2016 high.
So far, the metal shows no closing price above the Blue Arc. December 2017, last candle of 2017, denied again a close above Blue Arc. Accordingly, Blue Arc is monthly as yearly closing base resistance.
Main support is 1*1 Bull Market Angle. At 1*1 Angle we observe 3 consecutive higher lows. Last accurate test of 1*1 Bull Market Angle from above = successful backtest was at December 2017 FOMC meeting low.
January 2018 looks bullish because metal trades above Blue Arc combined monthly and yearly resistance magnet.
==> As far as trading rules are concerned, the very first monthly close above the Blue Arc means a strong GUNNER24 Buy Signal. This would be the first one since early 2016. Such bullish close above a combined monthly and yearly resistance magnet would be GROUNDBREAKING for the whole 2018 outcome, because this would mean that the 1st double arc would be reached and tested in countertrend direction and sometimes in the further course of the year 2018!
You see that a January and/or February 2018 close above current 1320.30 quotation should have broken circular Blue Arc resistance to the upside. On monthly closing base ...
But at the same time, we recognize and know that the Blue Arc threshold together with the 1322 yearly GUNNER24 Resistance Horizontal form a MONSTER RESISTANCE for gold. For January and February 2018. Which, if it could be overcome quickly now, would lead to a proper liberation and consequently to a massive rally and even perhaps to a very, very bullish 2018 uptrend year.
But first calm with the young horses. First, the 1322 must be cleared on monthly closing base. January still has a lot to offer. See more in the daily chart below.
And then there is this monthly up setup. It reveals, I believe, the true trigger that, if overcome, should lead to a buying spree and to the bullish resolution of the 1.5 year sideways phase!
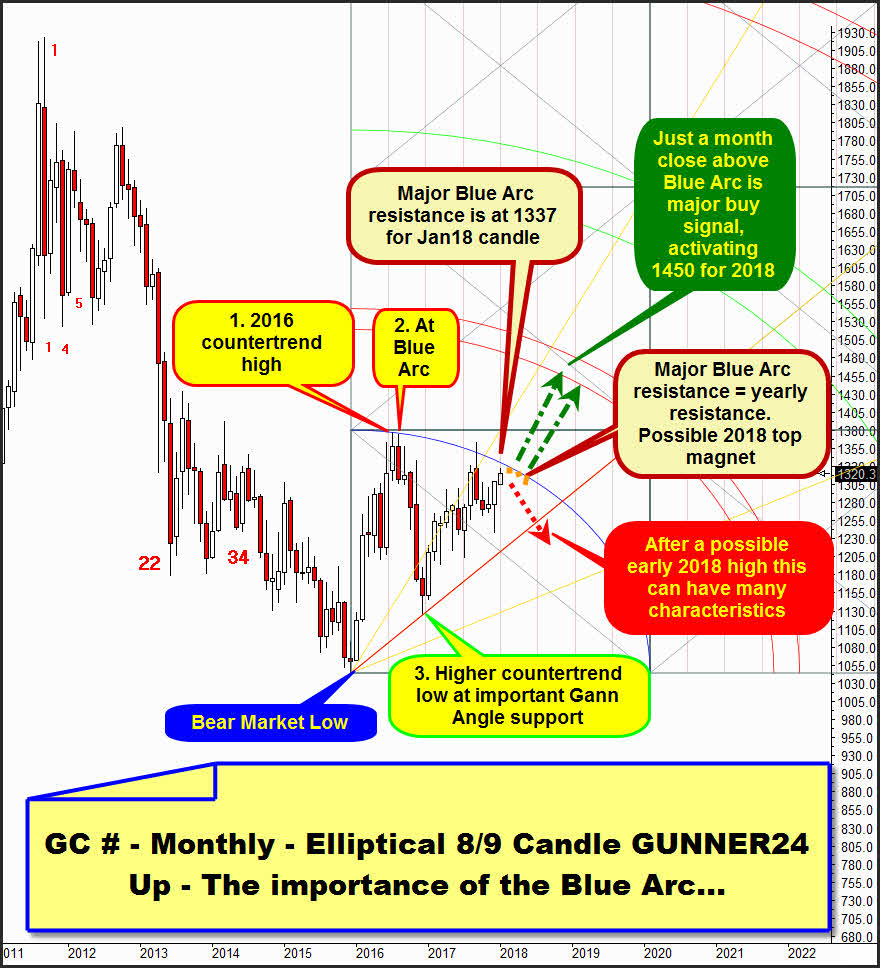
Above you recognize an elliptical 8/9 Candle GUNNER24 Up in the monthly scale. It also starts measuring at 2015 Bear Market Low, and it brings the most important 3 extremes (ABC) of this countertrend in direct relation.
It determines the future Blue Arc main resistance course by the direct connection of the current A) Bear Market Low.
B) 1. 2016 countertrend high, directly followed by 2. small lower countertrend high which confirms that elliptical Blue Arc is important future resistance for gold and
C) 3. most important higher countertrend low, precisely nailed at most important Gann Angle = most important existing countertrend support.
==> With these 3 most important measuring points (ABC = most important bullish/bearish extremes) of the countertrend the prediction of the future position of the Blue Arc main resistance should be much more precise as identified within circular 8/9 candle up.
==> Thus, the actual strongest yearly resistance in the current month should be exactly at 1337$. And for February 2018 accordingly at a 1333$.
==> As a result, it would take a month's close above 1342/January or 1338/February to be the next decisive GUNNER24 Buy Signal.
As already described above: this bullish close above a combined monthly and yearly resistance magnet would be GROUNDBREAKING for the whole 2018, because this would mean that the 1st double arc would be reached and tested in the trend direction and sometimes in the further course of the year 2018!
==> IF gold is able to close above 1342/January or 1338/February, the shiny metal should test 1st double arc in course of 2018! Thus 2018 uptarget would be a serious test of 1450 to 1480!!
Of course, the final overcoming the elliptical Blue Arc can be delayed for a long time. The 1.5 year sideways trend could continue for many more months because the Blue Arc wants to be insurmountable obstacle for the next few months. That would be the orange-dotted scenario! The Blue Arc would remain main resistance for 2018!
Since the elliptical Blue Arc is a confirmed falling annual resistance, it may even be that either the January or the February 2018 delivers the final high of 2018 or the final high of the first half of 2018! The next lower high on yearly base of this countertrend! Gold could start a bigger and stronger monthly downcycle once current test of the elliptical Blue Arc will be a negative one. For this watch the fat red-dotted arrow possibility!
Next, we will analyze the daily chart to assess the upcoming short-term developments. To assess whether gold is in the position, or might be able to resolve the yearly arc resistances upwards within the next few weeks resp. days:
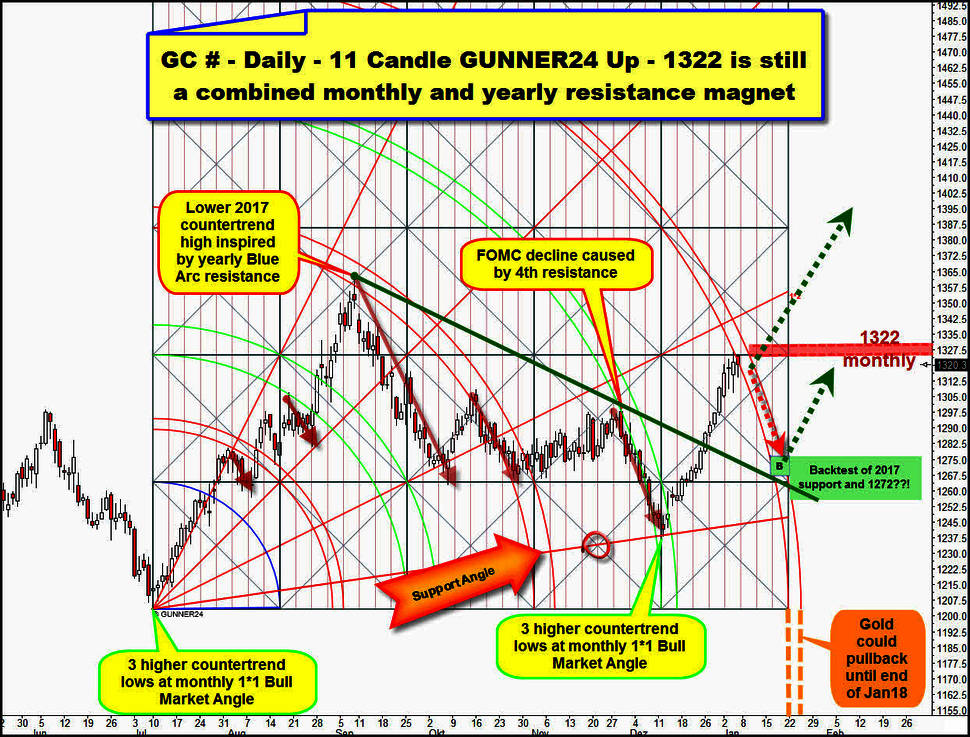
Above is important GUNNER24 Up Setup in the daily, starting at July 2017 cycle low.
Final 2017 high, the next lower countertrend high in the yearly time spiked into natural uptarget of 3rd double arc. There the currently running weekly and monthly downtrend began. the falling 3rd double arc was a stubborn, 2 month-lasting resistance.
Once downwards influence of the 3rd was over, gold walked more or less sideways till 4th double arc was met. The down swing into December FOMC meeting was triggered after first hit of 4th double arc from below. Ongoing 4th double arc resistance pressure forced gold lower into next higher countertrend low on monthly base.
At final December 2017 low, a naturally anchorable Support Angle together with monthly 1*1 Angle support (= combined daily & monthly angle support magnet) triggered the turnaround which Friday found resistance at 1322 combined monthly and yearly GUNNER24 Horizontal Resistance magnet & at 5th double arc.
Gold is now at daily double arc resistance and the well-known and dreaded 1322! It has reached major = very strong 2018 resistance area and is consequently poised for its next daily downtrend cycle. Which - actually - should follow the downward course of the 5th double arc, respectively should respect the downward pressure of the 5th double arc very much.
==> We have to accept this short-term course simply because any double arc in the setup above triggered a short-lived daily down swing resp. a harsh downtrend cycle. This simply shows the experience. Nearly always when all the 1st, the 2nd and the 3rd and the 4th have stopped a rise for short-term/have triggered a downtrend, the 5th will act in the same way.
The 5th double arc resistance influence could last into late January 2018. Then this double arc influence ends according time!
A normal pullback, that would like to follow the downwards pressure of the 5th, could lead to a clean backtest of the 1272 GUNNER24 Support Horizontal (now again most important support magnet in the monthly and yearly time frames) and even the declining thick dark green support could be tested back at January 2018 lows = 1265-1260 backtest in course of January 2018?!
The sooner a first decisive closing price above the daily 5th double arc main resistance succeeds, the more bullish the gold gets the coming months and into spring, I suppose!
A quite possible decisive daily close above the 5th main resistance within the next 5 to 10 trading days after the "round" 1300 support trail was defended, would be a very bullish harbinger for overcoming the 1322 to 1342-Jan18/1338-Feb18 yearly main resistance area until end of February 2018! This would activate a test of 1450 to 1480 upmagnet in further course of 2018!
You best register with our GUNNER24 Gold Trader now. That’s where we oversee the optimal entries and exits for you. Especially in the difficult market situations where many factors have to be considered the Gold Trader is backed by the additional GUNNER24 Signals based on the combined 1, 4 and 8 hour setups to catch the optimum entries and exits.
The GUNNER24 Gold Trader will provide you with the critical knowledge you need to forecast and analyse the precious metals with the GUNNER24 Forecasting Method. All the GUNNER24 Trading Signals you receive real-time are based on the actual Gold and Silver Future. The NEW GUNNER24 Gold Trader is a must for every actively working investor and trader who wants to trade successfully in everyday trading. The insights you receive from the head trader Eduard Altmann (and discoverer of the GUNNER24 Forecasting Method) are truly amazing sometimes. I promise!
Click the button below and order the GUNNER24 Gold Trader - $39.90 US a month. For 201 members and up - $49.90 US a month.
Be prepared!
Eduard Altmann


