Yeah, give it a proper beating. Stocks rise, gold drops. US$ rises, gold drops. US$ goes down, gold drops. Palladium and platinum rise, gold drops. Fiscal Cliff solution, gold drops. During the last weeks some daily buying signals were always denied at once, being sold-off severely. These are signs of a merciless downtrend.
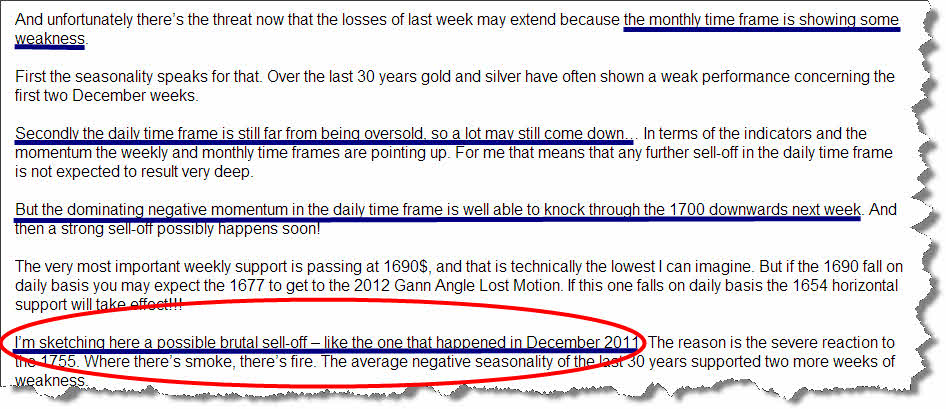
As happened in December 2011, by the year-end gold was just beaten down. Somehow I presumed such a scenario in my last free gold analysis (12/02/2012):
The main reason for the suspected sell-off was the unnatural violent reaction to the 1755 resistance in the monthly time frame. That’s where the market started to sell-off extraordinarily hotly. One thing is to diagnose a possible sell-off, but to live it every day occupationally being a gold bug, that’s what gets to one’s nerves being reflected in the investment account and the value of the physical continuance.
But the whole story begins much earlier – the reason for the original gold weakness:
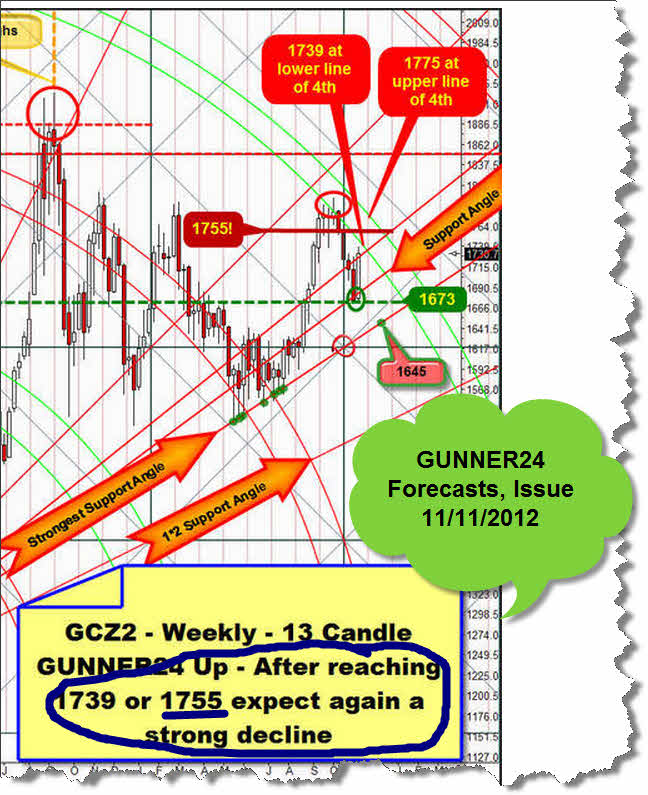
The true reason is the natural resistance put out by the weekly 13 Candle GUNNER24 Up Setup. It’s the accursed 4th double arc in this key setup. As early as by the beginning of November we were able to pre-determine the approximate course of the market pretty exactly. It went from the 1673 support up again to the 1739 or 1755, respectively. This 4th double arc has been reigning and determining/influencing the gold-price performance most violently since October 2012. And this 4th double arc keeps being our most important signaler for the medium-term gold performance:
The main resistance of the 4th double arc in the weekly time frame was pre-defined by the 13 weekly initial impulse – it started in 07/2010 finishing in 10/2010. It was the main resistance because the metals – unalike the other commodities, the pairs or the shares – love to turn strongly at the 4th double arcs triggering some strong counter- or main trends.
Above at the 4th the October top 2010 compelled gold to the first downleg = A-wave. The B-wave topped within the lines of the 4th at the combined weekly and monthly 1755 resistance. With the Friday lows the very best preconditions for a rather short-term turn upwards have occurred now.
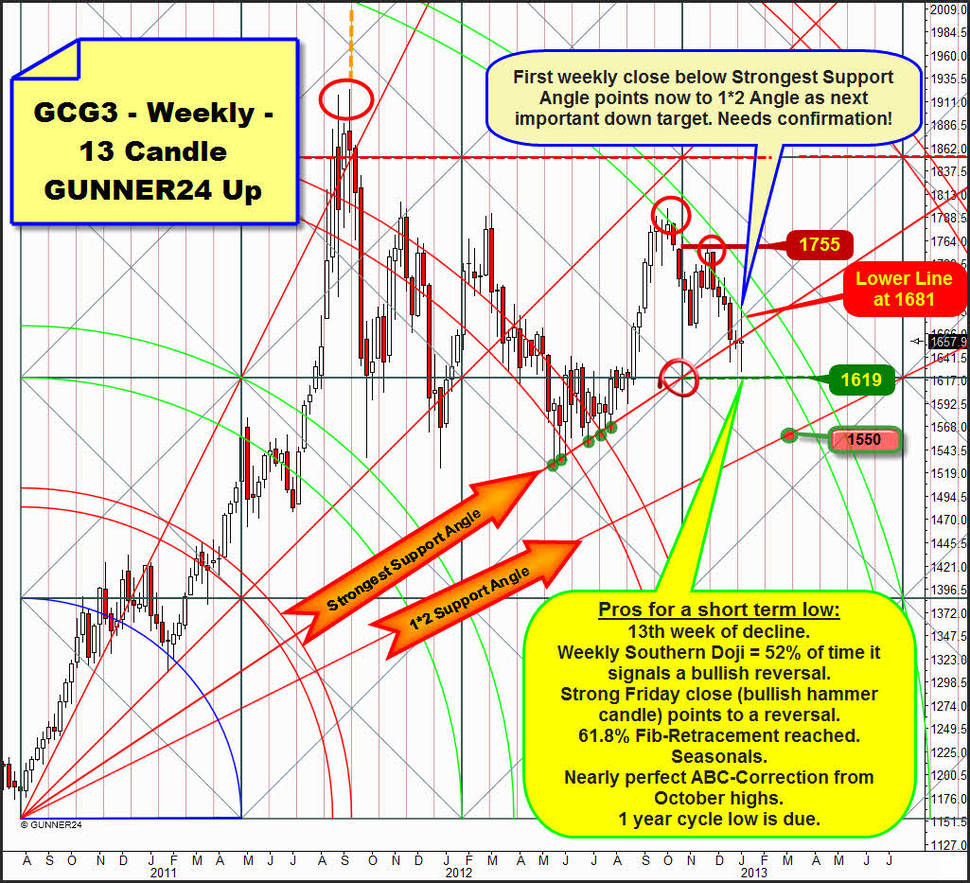
Nearly all the trading techniques I know, which I have learnt, that I have picked up over the last 15 years are pointing now to a very significant weekly low – actually everything is fitting:
A) Friday produced a Hammer Candle, that’s what is pointing to a change in trend.
B) The daily indicators are brutally oversold. A change is likely.
C) The weekly indicators are oversold, that’s plenty enough for a medium-term change
D) Weekly Fib count: 13th week of correction. The markets like to turn at 5, 8, 13 etc.
E) The last week showed a Doji. Technically that’s just a sign of indecision. But I think I’m making out a Southern Doji. That is slightly bullish.
F) Now to the most important Elliot Wave observation: It’s a nearly perfect ABC-correction (individual wave proportions) of the summer rally. Read about that the analysis of one of the best living EW analysts Alf Field.
http://www.321gold.com/editorials/field/field010313.html.
Please mind with it that in spite of the Friday developments his analysis is still completely intact since it is based on the London fixings.
G) This EW analysis combined with the reaching of the 61.8% of the Fib retracement (1630.40$) in the gold futures on Friday and the visible reaction to this important retracement level is per se a clear indication to an important final swing low.
H) The seasonal items often show important lows in the first or second trading week of the year before the spring rally starts. In January 2012, too, gold went off like a rocket. Since December 2012 performed as December 2011 did, why shouldn’t January 2013 perform like January 2012?
I) The cycles pointing to an important 1 year cycle low. The deepest low of the correction since the all-time high was reached on 12/29/2011 (GC # at 1523.9). Well, one or two weeks of delay are allowed for such an important cyclic event!
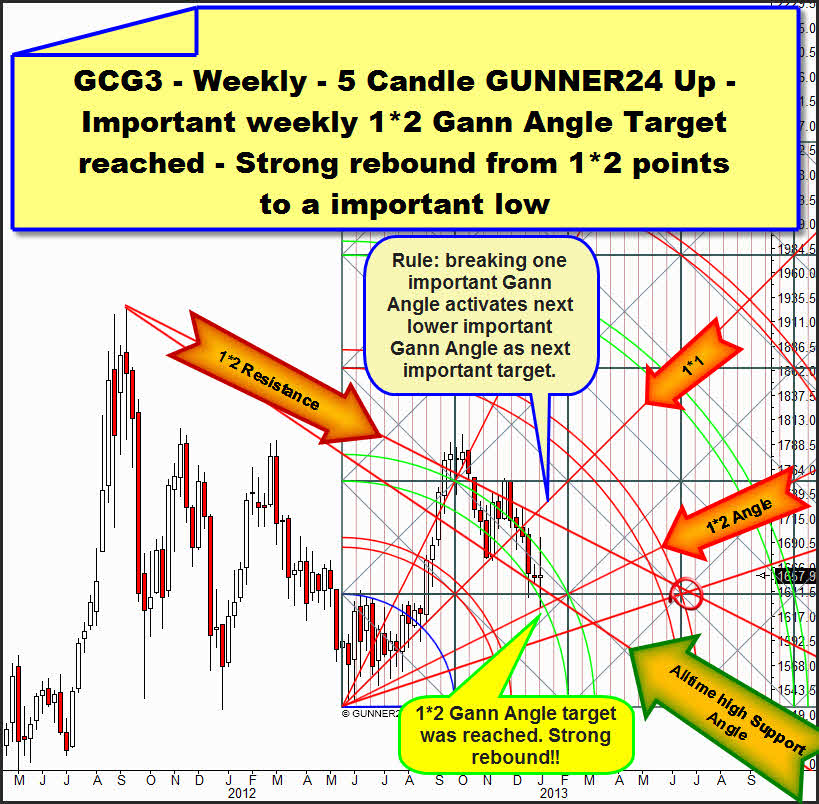
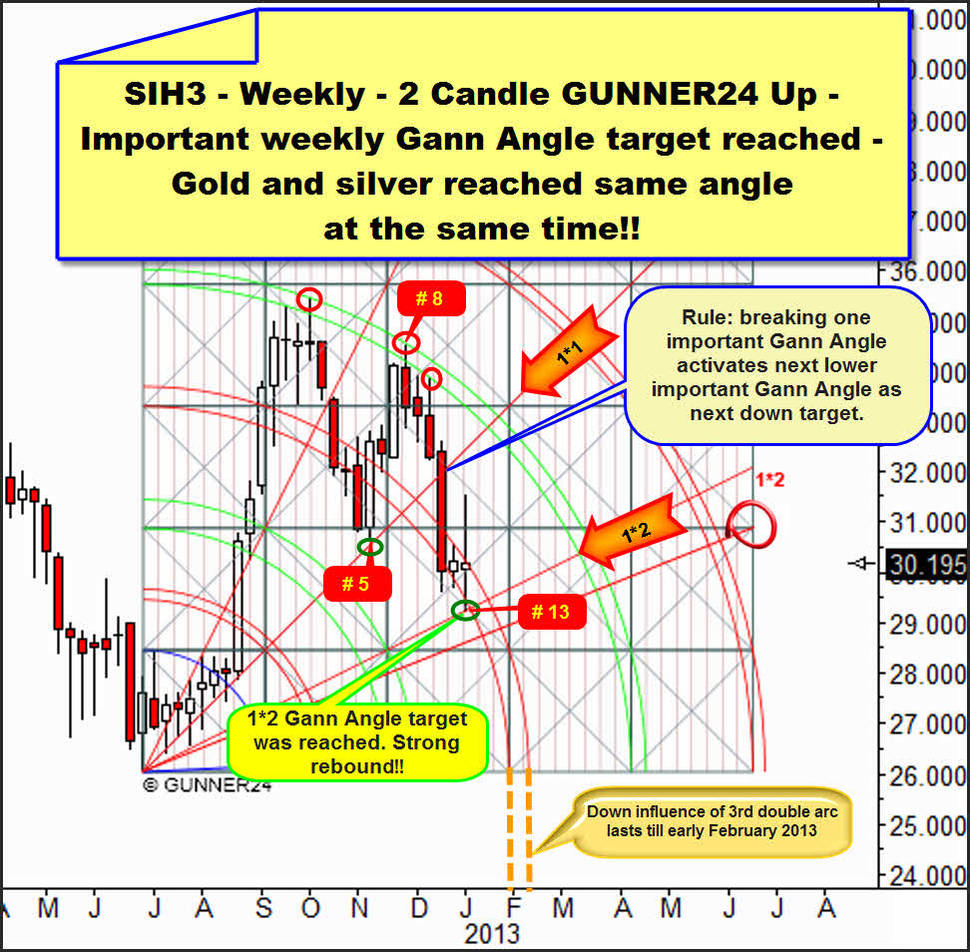
J+K) Also the weekly Gann magnets in the shorter observation period are pointing to a significant weekly low. The weekly GUNNER24 Up Setups for gold and silver we use to measure up the summer 2012 rally, simultaneously – at the same day – worked off their Gann Angle down targets. First gold:
After the final break of the 1*1 angle the 1*2 angle was activated as to be the down target. The significant Friday rebound is supposed to continue. In this setup, too, gold is situated in the sphere of influence of a double arc. This one has caught gold pressing it down so to speak. We’ll see which one is going to win: Is it the new defense forces because the 1*2 angle with its rebound energy wants to dominate now or is it the possibly continuing down influence of the 2nd?
Also important is the realization that the all-time high support angle is still holding on closing-price basis. A weekly close above 1690 next week would assure that the worst is over for the coming 3-4 weeks!
Also silver...
reached its 1*2 angle down target on Friday. The same strong rebound energy as in gold is suggesting that it may go upwards now… Please look additionally to the Fib count of the correction. Week # 5 wave A lows. Week # 8 wave B highs. Week # 13 possible and maybe important wave C lows. It’s a perfect Fib-count harmony! That one will be destroyed if a lower low is made. A new lower low – for instance in week # 15 or so – and a final correction low won’t be expected before week # 21 or around it.
Here we have got the same double arc dilemma as in the weekly gold 5 candle up. For 2-3 weeks silver has clearly been situated in the sphere of influence of the 3rd double arc. The 3rd can pull silver and gold as long as time is mature for a significant turn. By the beginning of February the down influence of the 3rd will come to an end. But I forecast that silver first has room to move upwards for 3-4 weeks, until the 4th double arc shall ring in the next hefty decline again.
All the pros, all the items from A) to K) seem to perfect to be true. Is it really that simple?
The drop of bitterness for the model of a persisting rise with final year 2013 lows is the Gann method… It says that it should go still lower again! It’s not going to be a three wave ABC correction but a five wave down move.
About that please pay attention to the actual weekly close shortly below the Strongest Support Angle in the very important weekly 13 Candle GUNNER24 Up! Certainly no final break of this angle is actually present, but the close beneath it is suggesting that Gann is not in harmony with the other important forecasting instruments.
Gann and GUNNER24 won’t indicate green lights for new longs before the 4th double arc is finally broken upwards and definitely on closing base. That’s about 1730 on weekly base…
It’s supposed to become interesting in the 1681 surroundings. Since last week finished strong, technically the 1680 surroundings should thoroughly be reached until the middle of next week. That’s where the lower line of the 4th double arc is situated. Technically a new hefty attempt to break the current lows should start there. Unless the market rebounds from the 1680 level, i.e. next week finishes above 1680, and – this is important - unless the volatility gets back visibly, as early as next week we will have the confirmation for the 1720 to be the weekly up target where in about 3-4 weeks the final leg of the then five-wave down move is expected to start from.
As a result the Strongest Gann Angle should be broken finally. According to Gann, next down target will be the 1550 then! But if the Strongest Weekly Gann Angle breaks as early as in the course of next or the week after next there will be the chance of getting to 14xx.
The signals of the monthly time frame are pointing strongly to such an outcome as well as the weekly key-setup does.
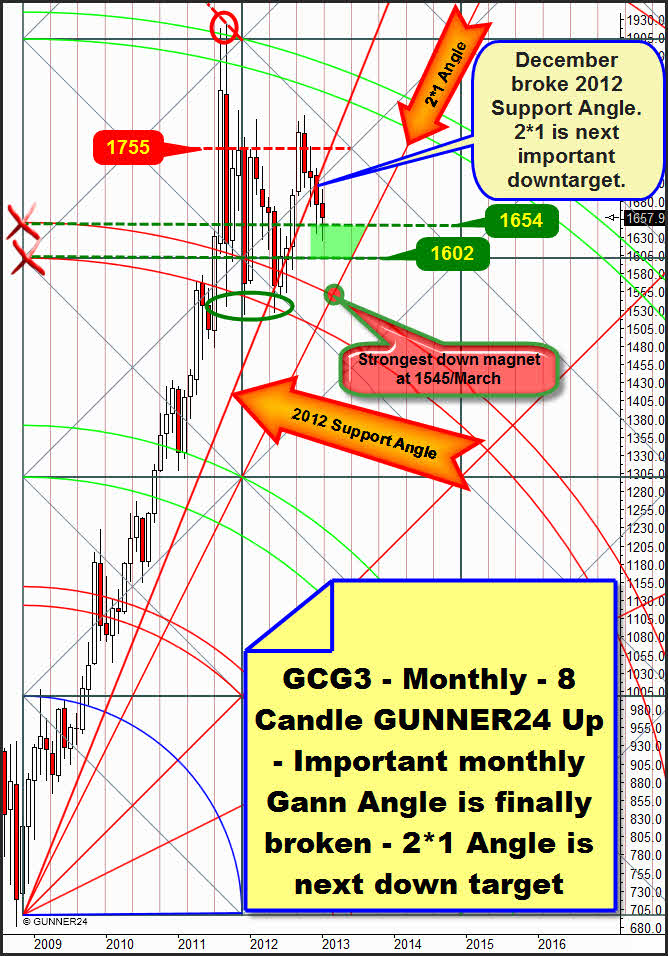
The problem for gold is that in December 2012 the support angle was clearly broken downwards that had backed gold for the entire year 2012. This final break is technically expected to make the current downswing accelerate! According to the rules concerning the breaks of Gann Angles, now the 2*1 Gann Angle is activated as the target. Between the 2012 Support Angle and the 2*1 Gann Angle there is no angle left that might be identified by the GUNNER24 Forecasting Method.
This fact will ensure that the monthly downswing cannot be finished before the 2*1 will be reached. It is pretty likely that the decline won’t be allowed to finish before the next identifiable down magnet will be reached in 3-4 months. This down magnet is situated at the intersection point of the upper line of the 3rd and the 2*1 angle, at 1545!
The monthly setup is actually putting out a very strong horizontal support area – 1654-1602. Where the lines of the 3rd intersect with the beginning of the setup we can always derive a horizontal support. This support area is still holding up. It is also thoroughly able to provide final support, together with all the plus items A)-K) mentioned above chasing the market to its up-target, the 4th double arc.
The reasons against are – as I said – the Gann Angle rule and furthermore the extremely bearish indicator situation in the monthly time frame. There’s still a lot of space downwards before it is oversold even rudimentarily, and the market is now much closer to the 3rd double arc than to the 4th double arc. The magnet function of the 3rd is now attracting gold stronger than the forth is able to. The confirmation for the 1545 down target will be received in case of a monthly close below 1654!
In these whipsaw markets of the last weeks that might confuse any trader thus leading mercilessly to burning the trading account the professional signals have got their special importance. You get them in the GUNNER24 Gold Trader!
You best register with our GUNNER24 Gold Trader now. That’s where we oversee the optimal entries and exits for you. Especially in the difficult market situations where many factors have to be considered the Gold Trader is backed by the additional GUNNER24 Signals based on the combined 1, 4 and 8 hour setups to catch the optimum entries and exits.
The GUNNER24 Gold Trader will provide you with the critical knowledge you need to forecast and analyse the precious metals with the GUNNER24 Forecasting Method. All the GUNNER24 Trading Signals you receive real-time are based on the actual Gold and Silver Future. The NEW GUNNER24 Gold Trader is a must for every actively working investor and trader who wants to trade successfully in everyday trading. The insights you receive from the head trader Eduard Altmann (and discoverer of the GUNNER24 Forecasting Method) are truly amazing sometimes. I promise!
Click the button below and order the GUNNER24 Gold Trader - $39.90 US a month. For 201 members and up - $49.90 US a month.
Be prepared!
Eduard Altmann

