And the identified S&P 500 Pullback Targets are ...
After the Friday turmoil, largely erasing Thursday`s strong gains and widely spread fresh alltime-highs, important pieces of the puzzle have been merged to an image, which suggests that the US stock markets may have printed tops of some importance. Precisely there and then, as our GUNNER24 Schedule provided.
Regarding this forecast, please read carefully here. You can also click on image for the call:
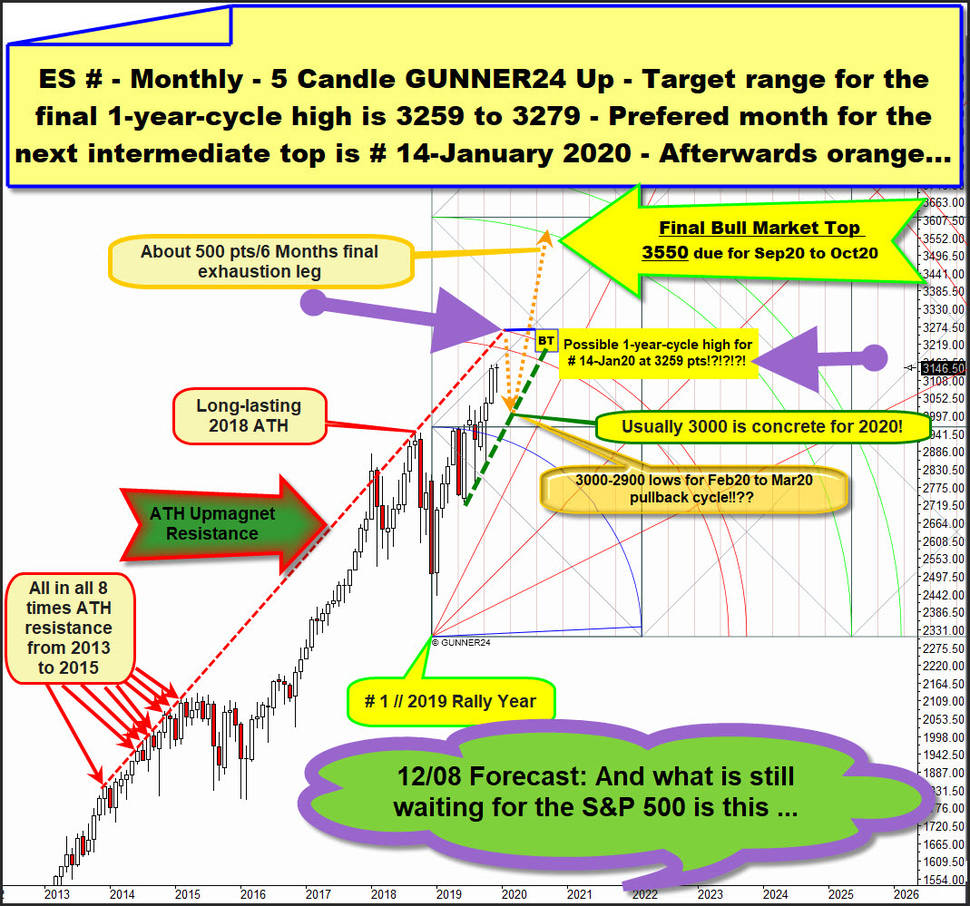
Within: http://www.gunner24.com/newsletter-archive/december-2019/08122019/
„And what is still waiting for the S&P 500 is this ...", I analyzed the possibly due very important exhaustion high`s outcome of this rally and most preferred option was that 1-year-cycle high`s for the US markets usually should be printed sometimes in course of January 2020, what is the 14th month candle of the at # 1 // final 2018 lows triggered next major bull market upcycle. 14-1 is the prominent 13 Fibonacci number. That for us as price/time traders always signals a possibly important upcoming turn in trend according the time in advance.
Early-December, we were able to identify the likely necessary future resistance upmagnet hit at 3259 pts, which exists for the entire January and is formed by the unusual steep ATH Upmagnet Resistance line, which has been repeatedly negative tested as worked out in the monthly chart above, and the upper line of the 1st double arc important GUNNER24 Bull Market uptarget.
For the # 14-January 2020 candle of the S&P 500 e-mini futures contract, this combined alltime-high/monthly GUNNER24 Arc Uptarget resistance magnet is exactly located at 3259 pts. And I asked and pointed then whether the top will come in at a 3259 pts in course of January?!
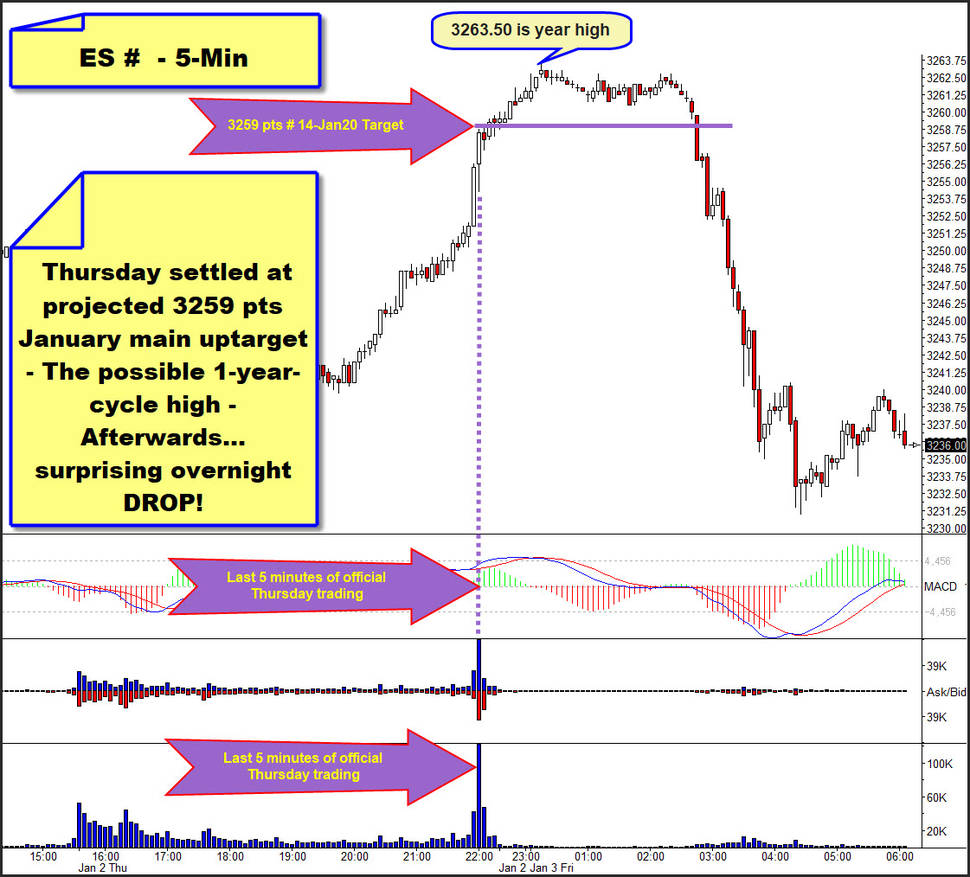
And now guess where the e-mini settled on Thursday before the missile dropped on Irans`s second best man?! Exactly at the 3259 MAJOR resistance upmagnet! Followed by a hard and surprising overnight drop which continued into a 3206.50 pts Friday low:
Above is the technical 5-Min chart of the the ES # e-mini Continuous Futures Contract and I express the view that in the last 5-10 minutes of official Thursday trading the overcoming of the 3255 rail caused some heavy short covering of the Big Whales which afterwards subsequently led to an exhaustion and a buyers strike.
It remains to be seen whether this bullish exhaustion will only be short-term or even medium-term base. In all cases, we have now a surprising reversal and received a first strong indication that a more or less important top is in. Exactly where and when we originally expected it. This is either a coincidence, or the plan.
Another important piece of the puzzle according printed important stock market highs was set in the gold pits. After the gold on Thursday for the second time closed above the dominant alltime-high Resistance Angle – a rail on combined yearly & DECADE base, the 5-monthlong Bull Flag resistance on monthly base is now pulverized with vigor.
And during the stock market futures sold off, the gold rally continued into an impressive 1555$ week close. Thus indirectly confirming that it is now underway for the very serious backtest of 1566$ what is year 2019 high environment. At same day the gold – likely – finally confirmed that it`s correction cycle is over, the ES # has worked of a main uptarget resistance magnet of this yearlong bull market and even perhaps printed it`s final 1-year-cycle high!
Cause a sealed final 1-year-high usually has at least bearish implications for near- and shortterm, but more likely also for midterm an ES # short attempt is now absolutely justified. Reward/risk ratio seems excellent as long as printed 3263.50 pts ATH will be used as SL, even if only some soft ES # pullback targets will processed before the rally may resume.
After all in this case, a final ES # 1-year-cycle high perhaps now delivered at the printed 3263.50 can lead to a stronger and longer decline back for the test of the Big Round 3000 support rail, as outlined in the starting monthly chart in orange-dotted... :
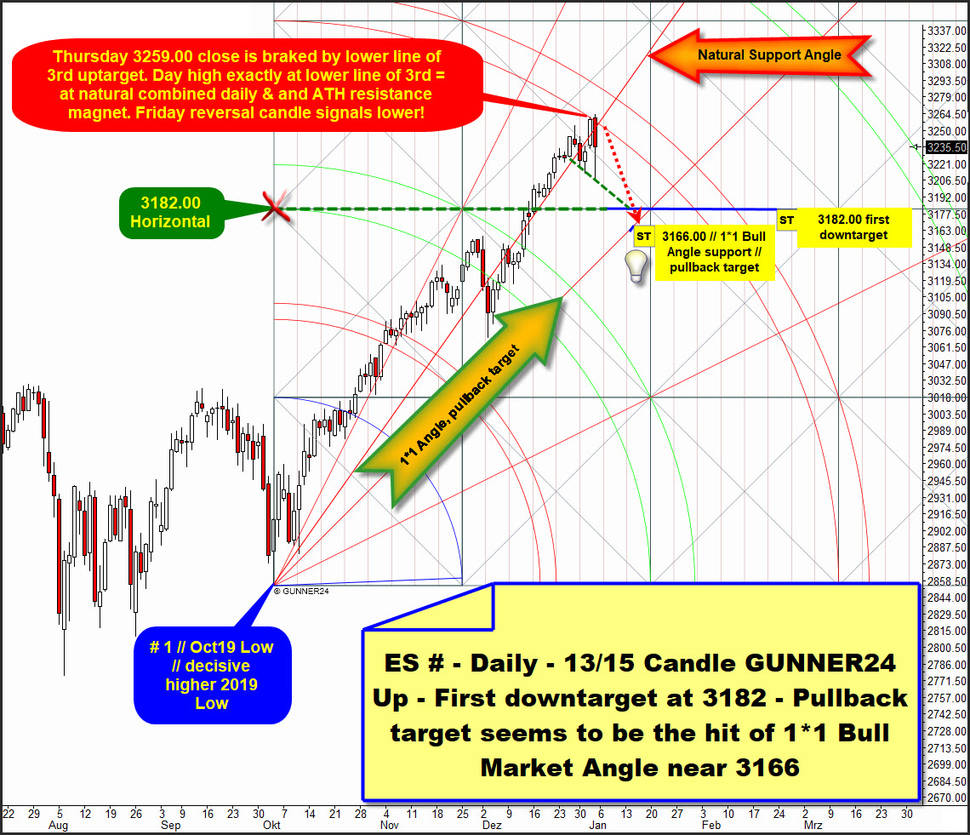
Ok now triggered, quite normal soft GUNNER24 Pullback Targets are these ones:
There is a natural GUNNER24 Horizontal Support at exactly 3182.00 pts. Most prominent soft pullback target is the most important backtest magnet out of # 1 // Oct19 Low, what was last decisive higher low of the rally year 2019. The possibly started pullback has a nice high odd to deliver the very first test of 1*1 Bull Market Angle!
The 1*1 Bull Market Angle support attraction might be tested within a quite normal 8 to 13 days pullback cycle. For then the 1*1 Bull Market Angle out of # 1 // Oct19 Low takes course at around 3166.00 pts.
Just after the Thursday candle it became clear that this above shown classic daily 13 Fib number up setup is best matching daily setup actually.
Thursday`s high for sure and with a 100% accuracy became braked by lower line of 3rd double arc what is former activated important GUNNER24 Bull Market uptarget.
Of course the 3259 pts close of Thursday is also braked by that lower line of 3rd resistance. At Thursday high and close the price has met the time cause 3259 pts is at projected combined daily and ATH Resistance Magnet and the 1-year-rally cycle could have topped and perhaps turned there finally and the bull market which began at 2018 Xmas low is at month candle 14, what is 14 – 1 = 13 Fib number. This week candle is No. 54 of rally cycle!
I recommend to sell-short the market at possibly soon coming and maybe imminent backtest of the lower line of 3rd double arc natural backtest resistance. This arc should offer very strong resistance for the coming days!
==> First downtarget of a soft-pullback is sell-short setup is the 3182.00 pts daily support horizontal.
==> Natural downtarget for such perhaps just 8 to 15 day`s running pullback cycle is the first test of the daily 1*1 Bull Market Support Angle at around 3166.00!
However, now an intermediate top could be finally printed at 3263.50 and this offers a deeper and longer pullback resp. multi-week running correction for the Big Round 3000 pts backtest, what now usually has morphed to a mega-strong horizontal support on yearly base.
3000 seems to be the ideal & natural pullback target for a somehow longer lasting reaction cycle:
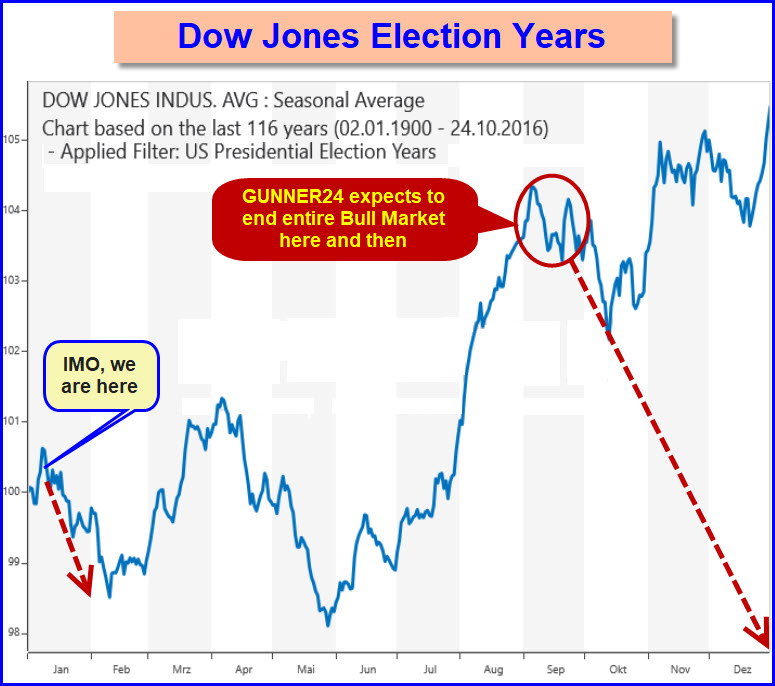
With regard to the most important extremes and turns of this longest bull market ever, the US stock markets have been following the average course of the 4-year US presidential cycle since November 2016 Trump elect with an accuracy of around 80%.
And in my eyes there is no reason to doubt that this election year 2020 - clearly, more or less quite reliably - will adhere to its unusually long-established seasonal guidelines.
Accordingly, we can now speculate on a somewhat longer and deeper downer. Means, usually a 3000 in terms of price, with the next important turn sometime in February or March. Followed by the Last Hurray into around a 3550 due for September-October 2020!
Be a part of our exclusive sworn GUNNER24 Trader Community – now... I try to make you rich!
- with daily trades – quick, safe and profitable…
- in well-chosen precious metals, commodities, indexes, currencies and in the best stocks worldwide...
- in both rising and falling markets…
- with little use of capital…
Be prepared!
Eduard Altmann


