Damned – Why just right now the low is developing?
Today, I'd like to offer you a little intimate insight into the secrets of the GUNNER24 Forecasting Method which has not ever been published anywhere. And give you some sort of idea so you understand why the price is performing the way it is.
With the traditional charting analysis, often we have a pretty hard time trying to understand the actual price performance. That actual daily chart of the EUR/GBP pair, stuffed with all kinds of trend lines and indicators, Fibonacci ratios etc. can't tell us why last Friday the first temporary end of the downwards move set in.
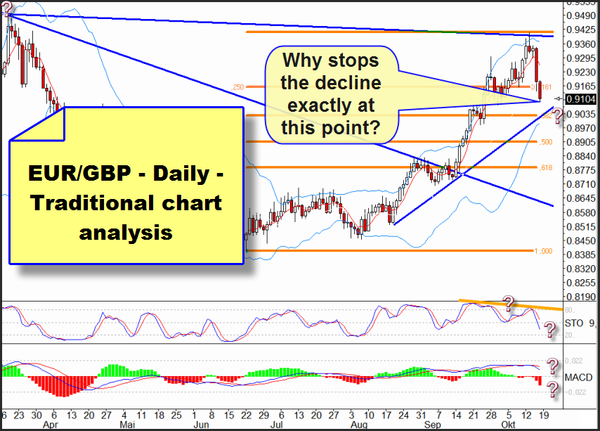 |
Everything is showing furthermore falling quotations, negative divergences etc. anyway, the price is not falling furthermore.
Well, the GUNNER24 Forecasting Method is founded on the following:
The GUNNER24 considers only the relevant impulse movement from where the future data develops.
That is the real and true impulse which the majority of the investors initiate and which the majority of the investors carry until the very majority quit. That impulse the GUNNER24 Initial Impulse is based on the supposition that the financial markets as well as our lives, our decisions, simply our entire environment go through cycles which can be measured.
When the majority stops following, the first trend move (initial impulse) is phased out. Based on this first impulse we can project precisely the course and the frame of the further price development. If you apply now the GUNNER24 you will not only realize there are space and time structures within the price fixing, but after studying intensely the GUNNER24 Forecasting Method you will be able to slip that discovery successfully into your trading, as well.
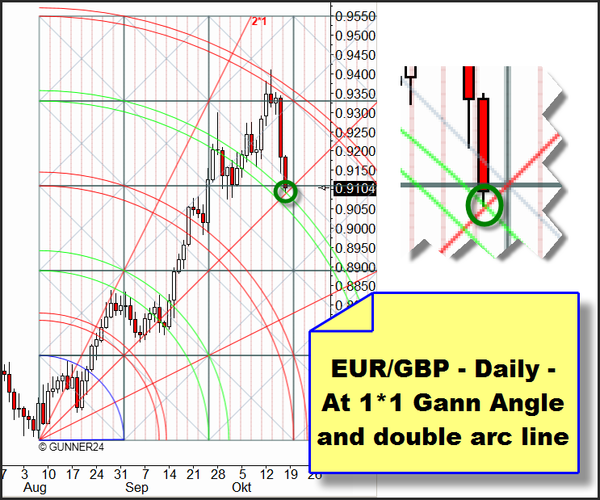 |
In the actual 7 Candle Daily GUNNER24 Up Setup, after reaching the main target a counter-reaction set in which ended on Friday precisely at the important 1*1 Gann Angle AND the upper line of the 4th double arc. That point (the daily low) stopped the price decline.
If you place now a 5 Candle GUNNER24 Down in the 4 hour chart...:
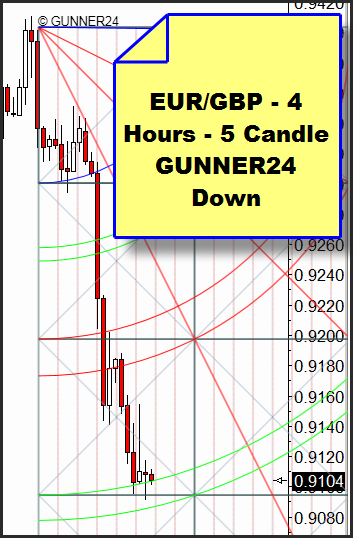 |
You see the daily low has formed above the important 3rd double arc. The price has not closed within the double arc so by the actual state of information we should assume that Monday morning a reversal candle might form which then, with the beginning initial impulse we could join trading.
Now combine the present state of information with the following GUNNER24 Up Setup...:
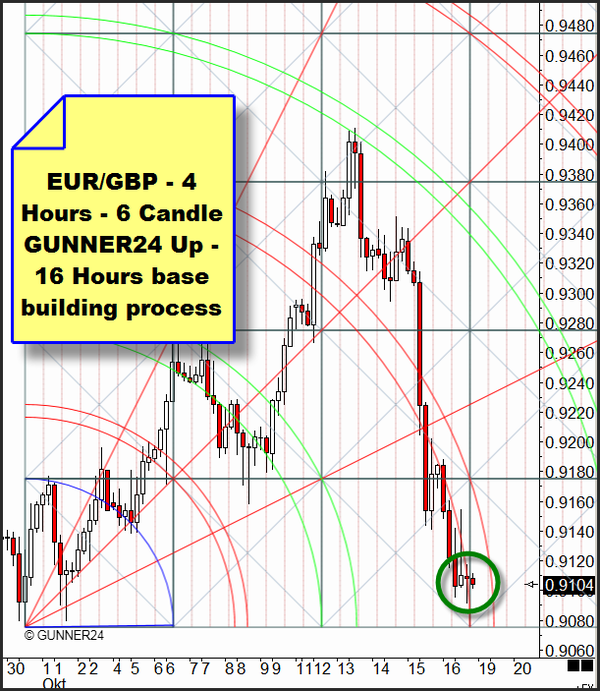 |
Here, we see that on Sunday and Monday the price still remains 12 hours within the temporal influence area of the important 3rd double arc. That means within the next 3 candles we may expect an increased energy influence on the price which will decide whether we mark a new low which threatens the whole upwards trend or a reversal candle producing a GUNNER24 Up with it.
The last two days, a very interesting and very well tradeable low finding process happened in gold:
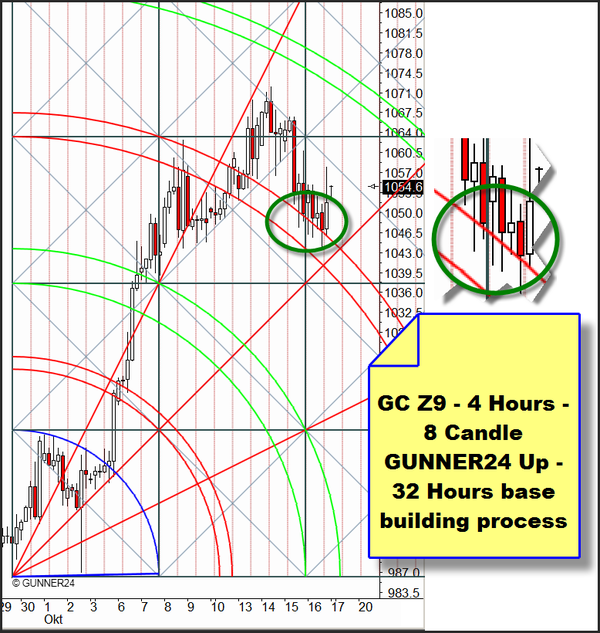 |
Nearly for two days the price followed the upper line of the 3rd double arc downwards until at the time line the absolute low of the retracement of the previous top appeared and the price turned running upwards again. Now we expect to reach the 4th double arc where for the moment we should develop a lower high.
I hope you can re-enact which wonderful trading possibilities the GUNNER24 Forecasting Method offers. Please click here in order to discover ALL the top secrets of the GUNNER24 Forecasting Method.
Let's have a short look at the stock market.
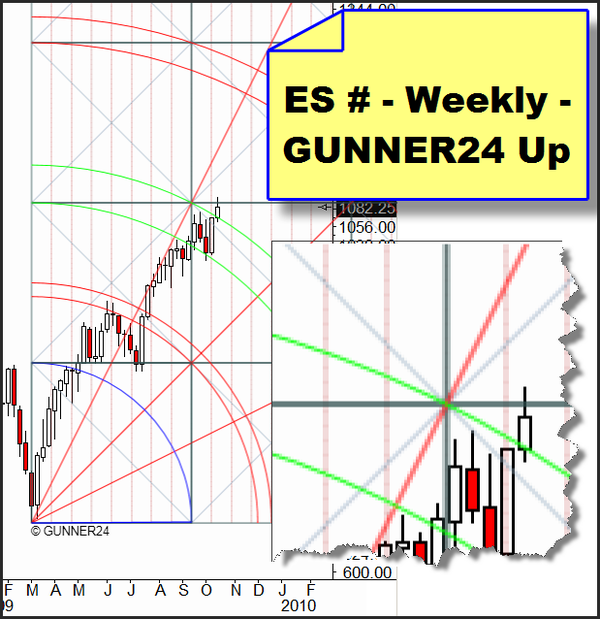 |
By the magnification of the chart you see that the final breakout from the 2nd double arc on lost motion basis has not succeeded yet. The upper horizontal square line offers resistance which might be overcome next week yet. If next week closes beyond 1089 we will open a long position. You can recognize that the price opened above the upper line of the 2nd double arc and shot over it. Thus, that line became a support line.
Happy trading!
Eduard Altmann
